
Walmart · Data Science
DSD: from a receiving summary to store detail.
Operational dashboards connecting receiving accuracy, regional comparison and location-level investigation.
- My role
- Lead UX Technologist · Data Science Platforms
- Period
- Oct 2019 – Feb 2022
- Designed for
- Receiving & store operations teams
AI leadership noteExplain a receiving exception
Original approach
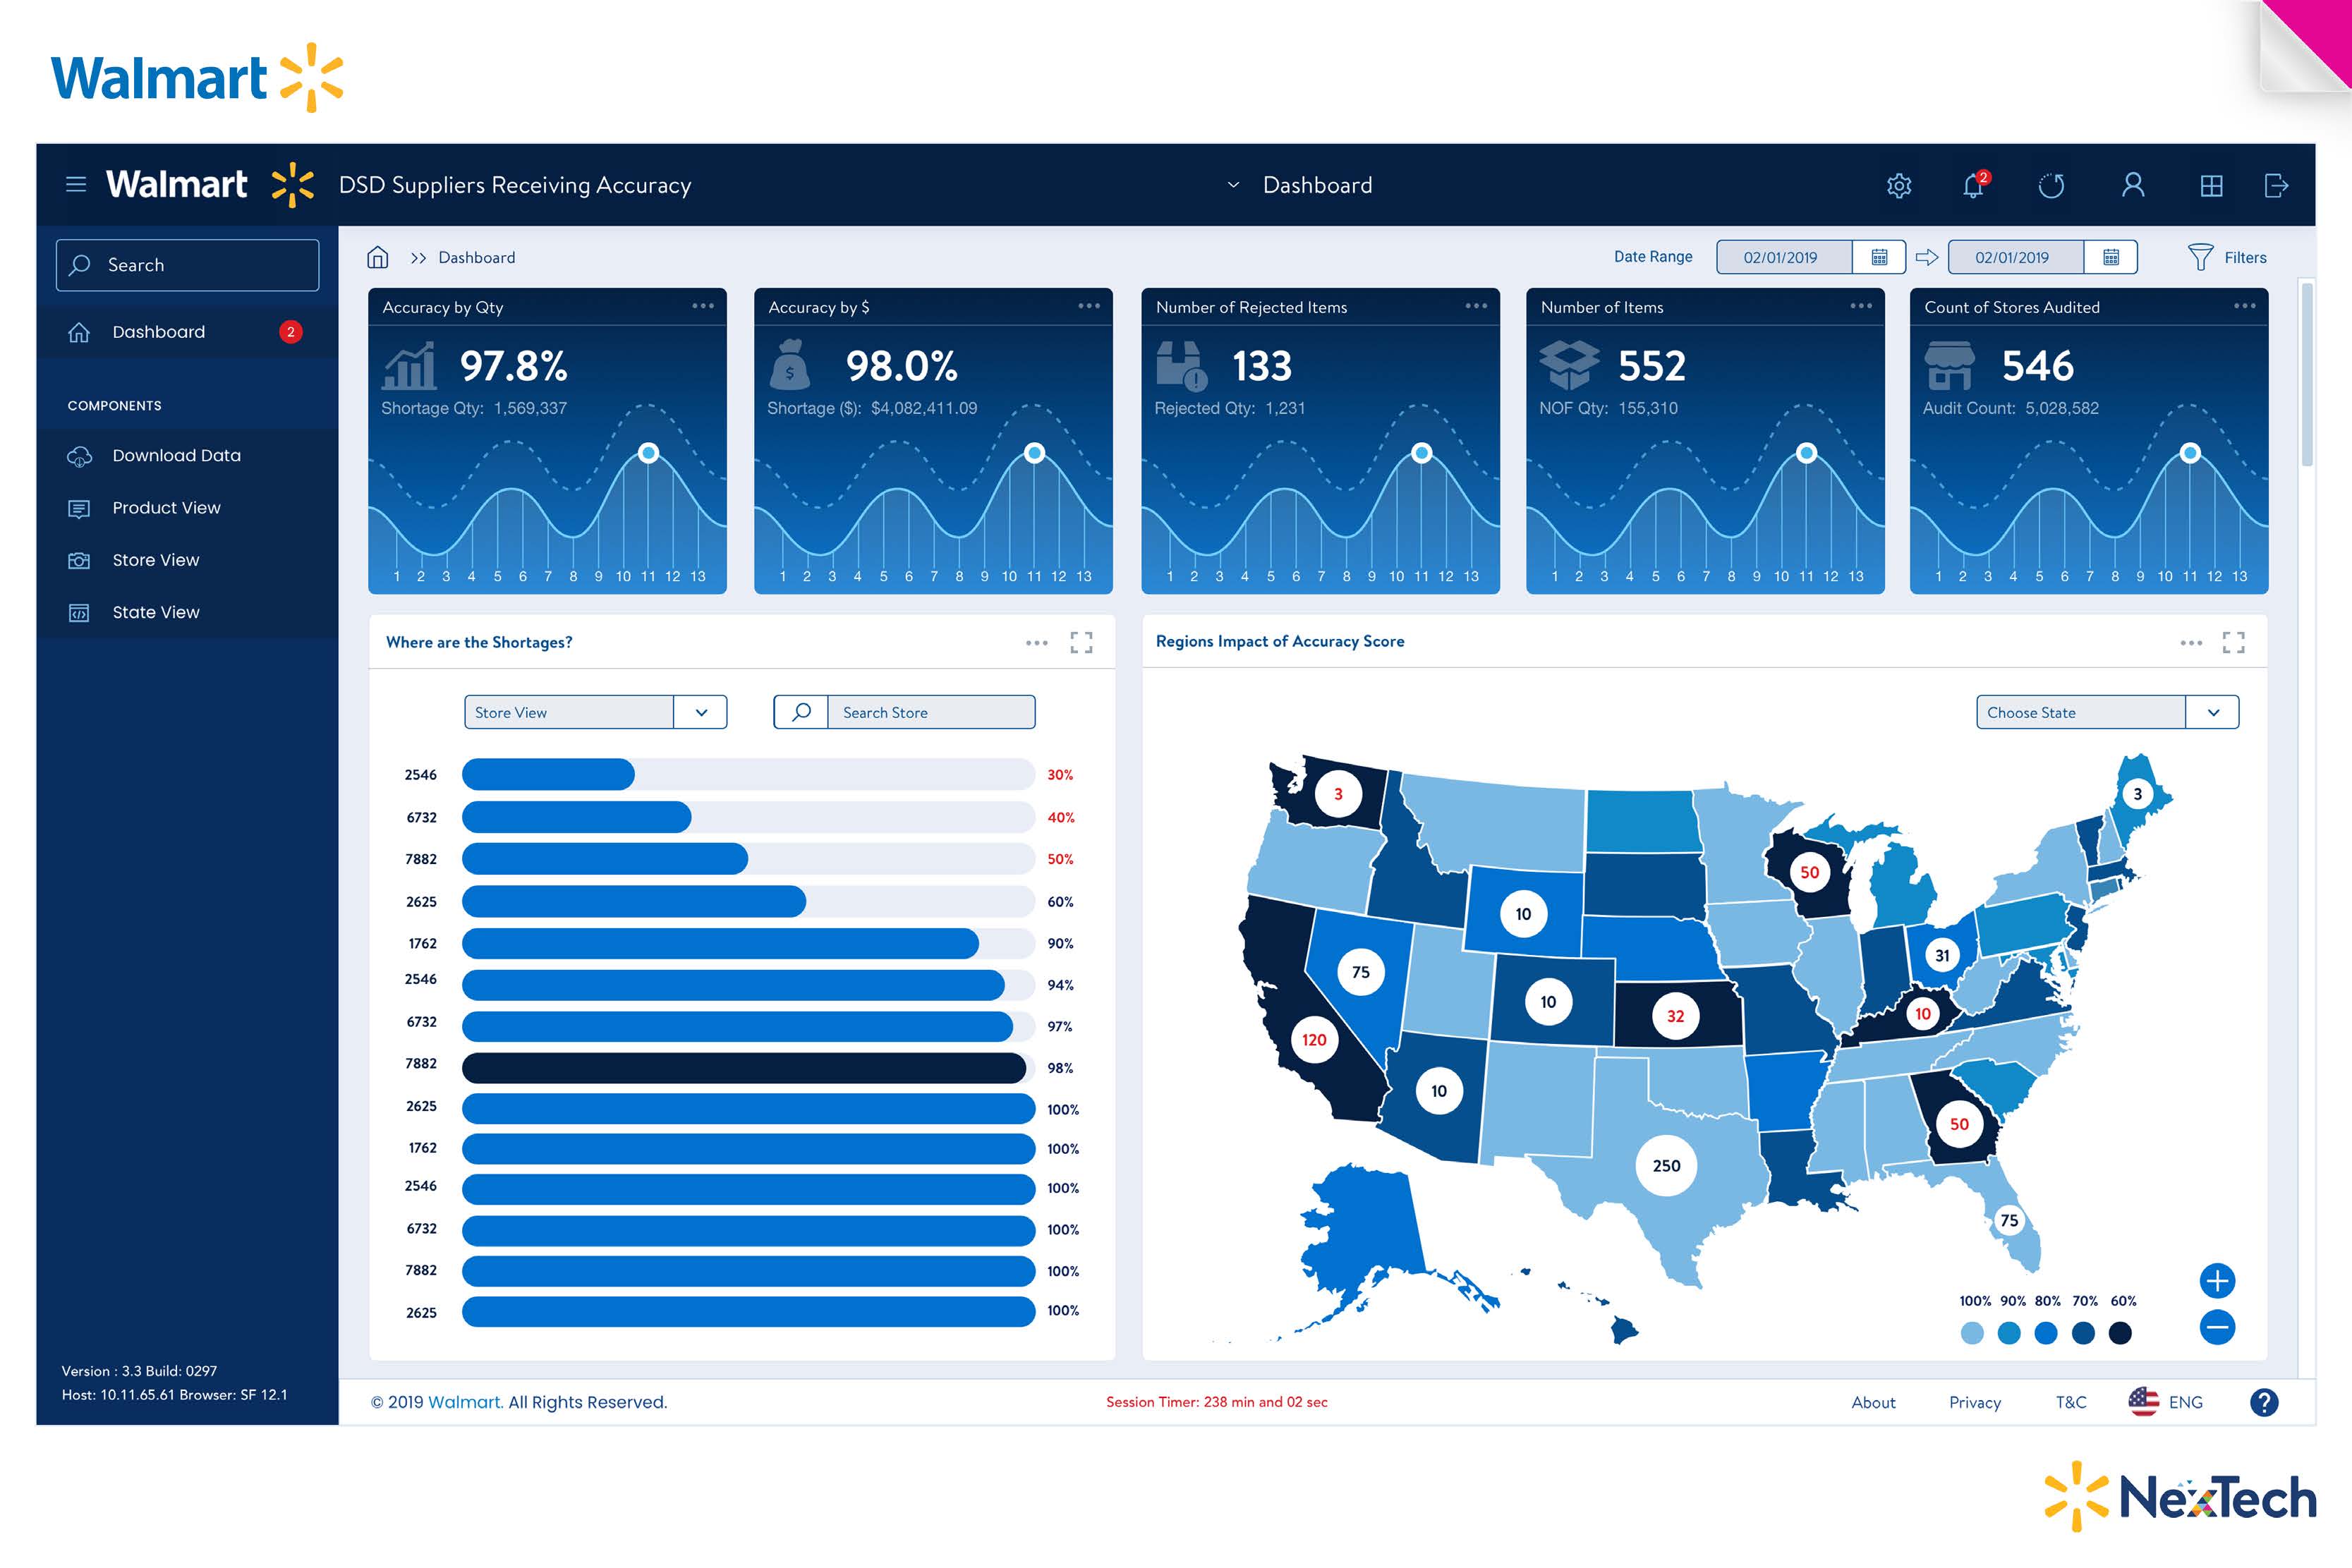
The receiving views bring quantity, value and rejection measures together with store comparisons and a regional map.
What could change today
Summarize the shipment, receiving entry and regional variance for one discrepancy. Let an associate inspect the source rows and choose what to investigate.
Workflow excerpt. The numbered steps show the same part of the journey in each version. The full project includes work beyond this comparison.
Original workflow
- Read the summary
- Compare locations
- Narrow the scope
- Inspect the records
Proposed workflow with AI
- Read a summary of receiving exceptions tied to source records.
- Compare discrepancies across stores and regions.
- Filter to an affected shipment and item.
- Inspect the original receiving entry before taking action.
How to test the change
Replay known receiving exceptions and check quantities, units and dates. Measure time to find the correct record.
01 / Customer & problem
The need behind the work.
Who needed this.
Operational teams need to investigate which stores and records sit behind a receiving-accuracy issue.
The problem to solve.
A national receiving summary can conceal the locations behind an issue. Operational teams need to move from an aggregate measure into the relevant stores and records.
Connect summary measures, regional views and detailed records through a consistent information hierarchy.
02 / My ownership
Responsibilities.
My UX work connected receiving summaries, regional comparisons and store-level records within Walmart’s Data Science Platforms organization. Product, engineering and data partners contributed to the broader application.
The constraint to work through.
National summaries, regional patterns and store detail operate at different scales. Moving between them must preserve the meaning of the measure.
- Read the summary
- Compare locations
- Narrow the scope
- Inspect the records
03 / Actions & delivery
How the work came together.
The receiving views bring quantity, value and rejection measures together with store comparisons and a regional map.
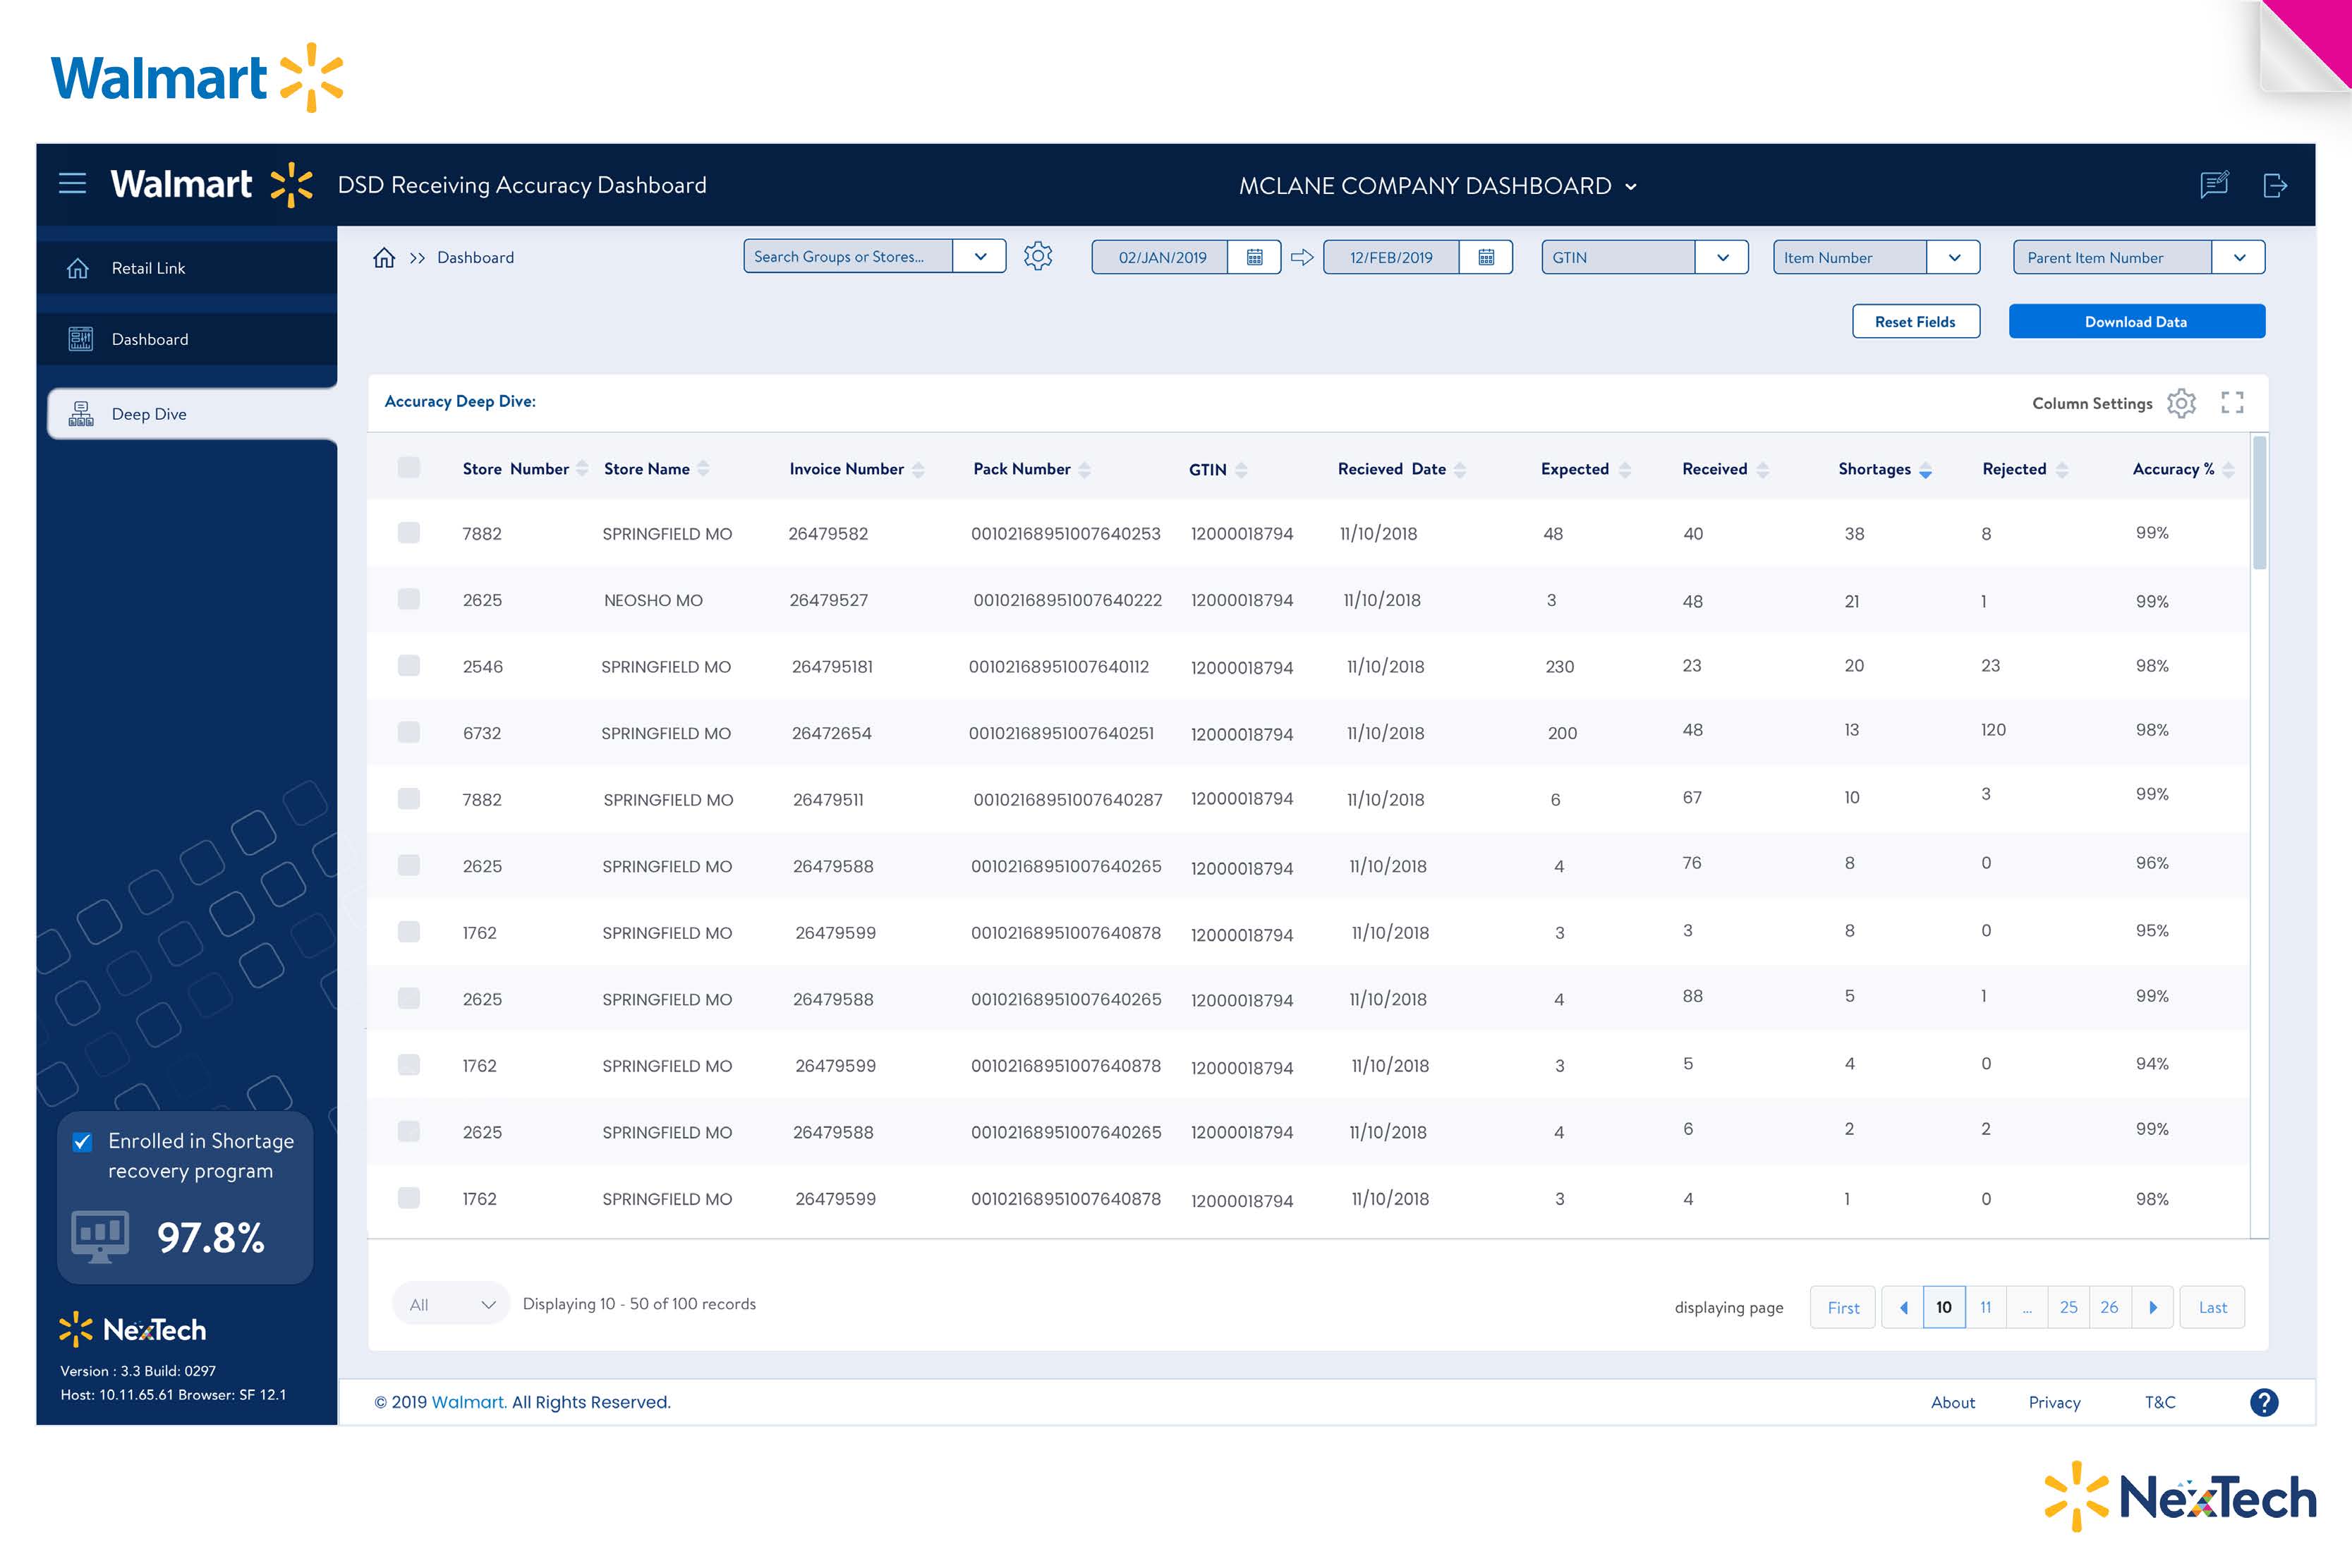
Filtering and table patterns carry the operational question from the overview into location-level information.
04 / Decisions & judgment
What carries through the design.
Give the summary a next step.
A measure becomes more useful when a person can investigate the locations behind it.
Keep comparisons consistent.
Repeated filtering and table structures support the transition between overview and detail.
The experience in detail
The work, as a connected experience.
Operational dashboards connecting receiving accuracy, regional comparison and location-level investigation.
01 / Understand receiving accuracy
Summary and regional information establish where to investigate.
02 / Inspect store detail
A shared table pattern carries the investigation into records.
05 / Results & business value
What changed through the work.
A connected set of receiving-analysis views linking summary measures with store and regional context.
Why it matters.
The dashboard design links quantity, value and rejection measures to regional comparisons and store-level records, supporting focused operational investigation.
06 / Reflection
Lessons for future projects.
Give every summary measure a meaningful next step. An overview becomes actionable when the user can inspect the locations behind it.
Let’s talk about your next chapter.
Exploring Senior Director, Head of Design and VP opportunities.