
Walmart · Data Science
Stadi: connecting customer wait times to staffing decisions.
A Walmart computer-vision application for understanding queue time, service time and associate coverage at service counters.
- My role
- Lead UX Technologist · Data Science Platforms
- Period
- Oct 2019 – Feb 2022
- Designed for
- Store operations teams
AI leadership noteCount uncertainty alongside wait time
Original approach
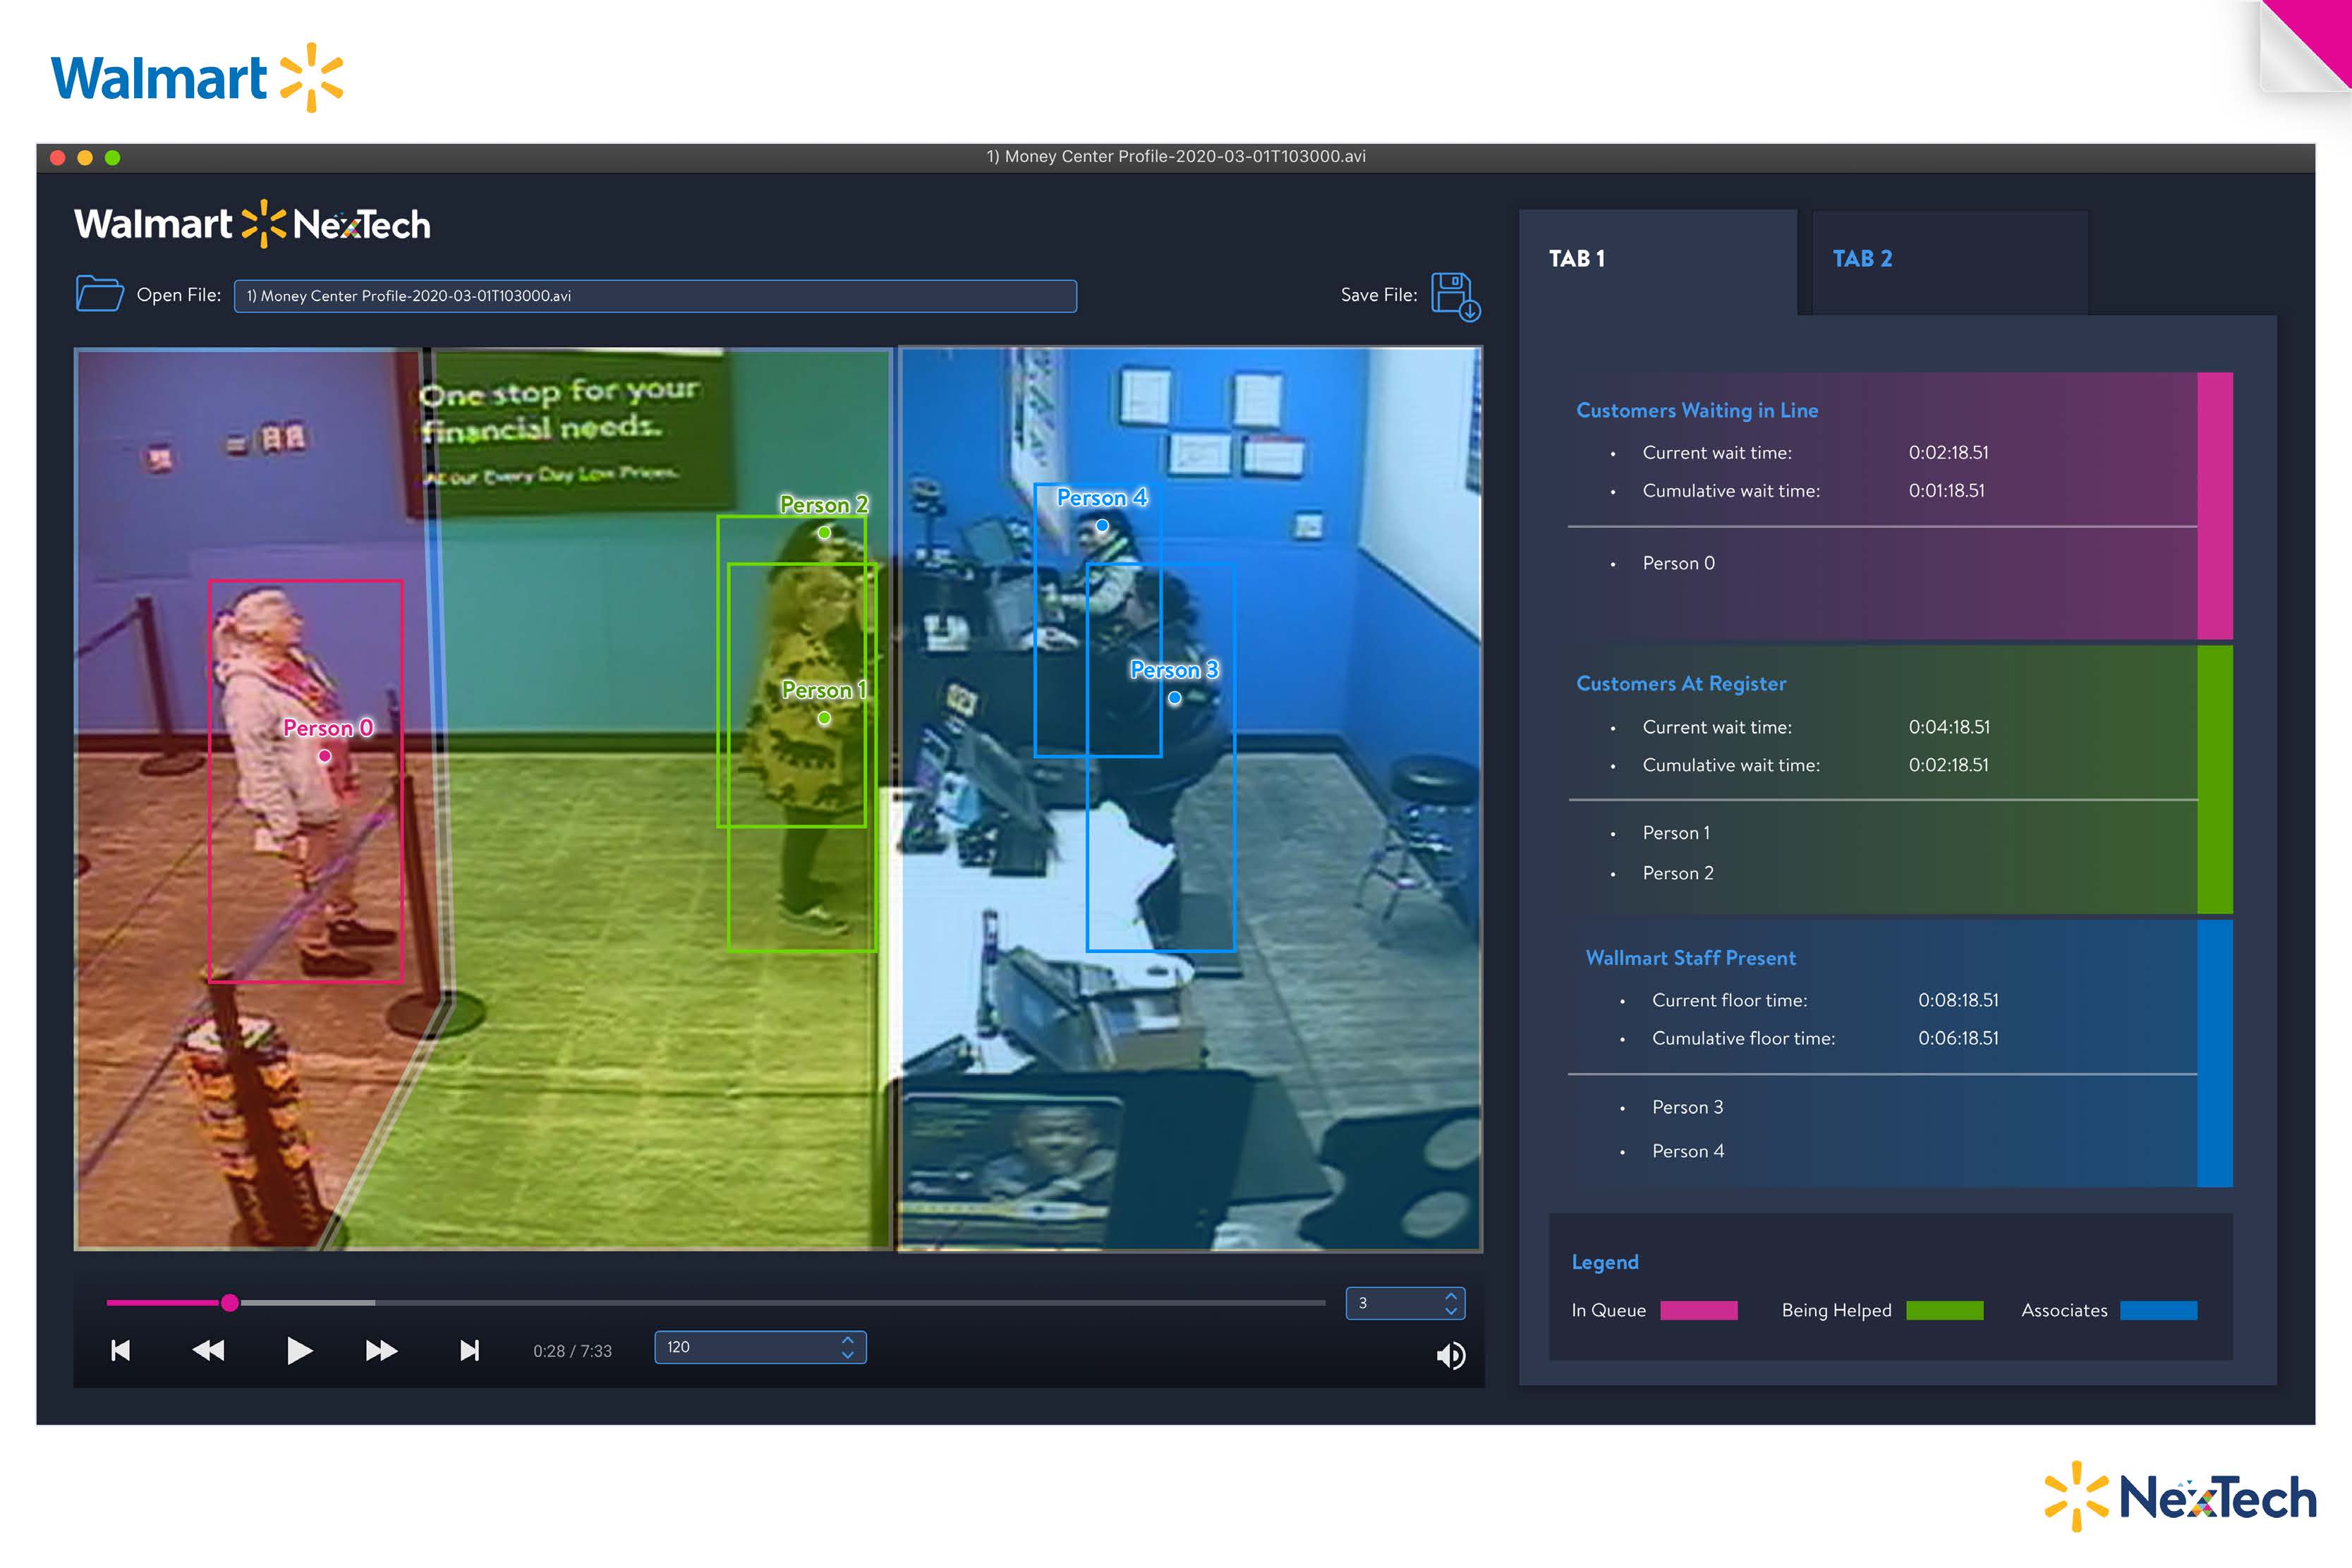
Computer-vision camera views segment customer activity so the team can track each person from waiting in line to receiving help. The interface keeps the visual observations alongside counts and elapsed time.
What could change today
Compare queue estimates across camera angles, partial occlusion and overlapping lines. Surface coverage gaps beside the estimated wait so a manager knows when to observe the counter directly.
Workflow excerpt. The numbered steps show the same part of the journey in each version. The full project includes work beyond this comparison.
Original workflow
- Observe the queue
- Track waiting & service
- Count associate coverage
- Evaluate staffing & capacity
Proposed workflow with AI
- Select a queue segment and check the camera view.
- Review suggested tracks against observed wait and service times.
- Verify associate counts when people overlap or leave the frame.
- Compare staffing scenarios using reviewed counts and delays.
How to test the change
Compare estimates with manually timed intervals during quiet and crowded periods. Review staffing decisions with the department lead.
01 / Customer & problem
The need behind the work.
Who needed this.
Store teams need to understand how customer wait and service times relate to demand and the associates available behind the counter.
The problem to solve.
A department can have long customer waits or more associates behind the counter than its workload needs. Managers need to understand the relationship between customer demand, service time and staffing before deciding how to allocate people.
Make customer wait times, service transitions and associate presence visible together, so teams can evaluate service capacity, time and staffing costs.
02 / My ownership
Responsibilities.
My UX work connected Stadi’s camera views, customer timing and associate-coverage information within Walmart’s Data Science Platforms organization. Computer-vision analysis was developed with the data science team.
The constraint to work through.
Waiting, receiving service and associate presence need distinct visual states. Staffing decisions require the timing and coverage to be read together.
- Observe the queue
- Track waiting & service
- Count associate coverage
- Evaluate staffing & capacity
03 / Actions & delivery
How the work came together.
Computer-vision camera views segment customer activity so the team can track each person from waiting in line to receiving help. The interface keeps the visual observations alongside counts and elapsed time.
Associate presence behind the counter adds the staffing context. The analysis supports questions such as whether two associates could handle the same demand as four, and how service time changes with coverage. The approach can be applied across departments.
04 / Decisions & judgment
What carries through the design.
Distinguish waiting from service.
Track when a customer enters the line and when their service starts. Separate states help reveal whether delay is happening before service or during it.
Connect coverage to demand.
Customer timing alone does not explain capacity. Associate counts provide the context needed to compare staffing with the workload being handled.
The experience in detail
From camera observations to service-capacity decisions.
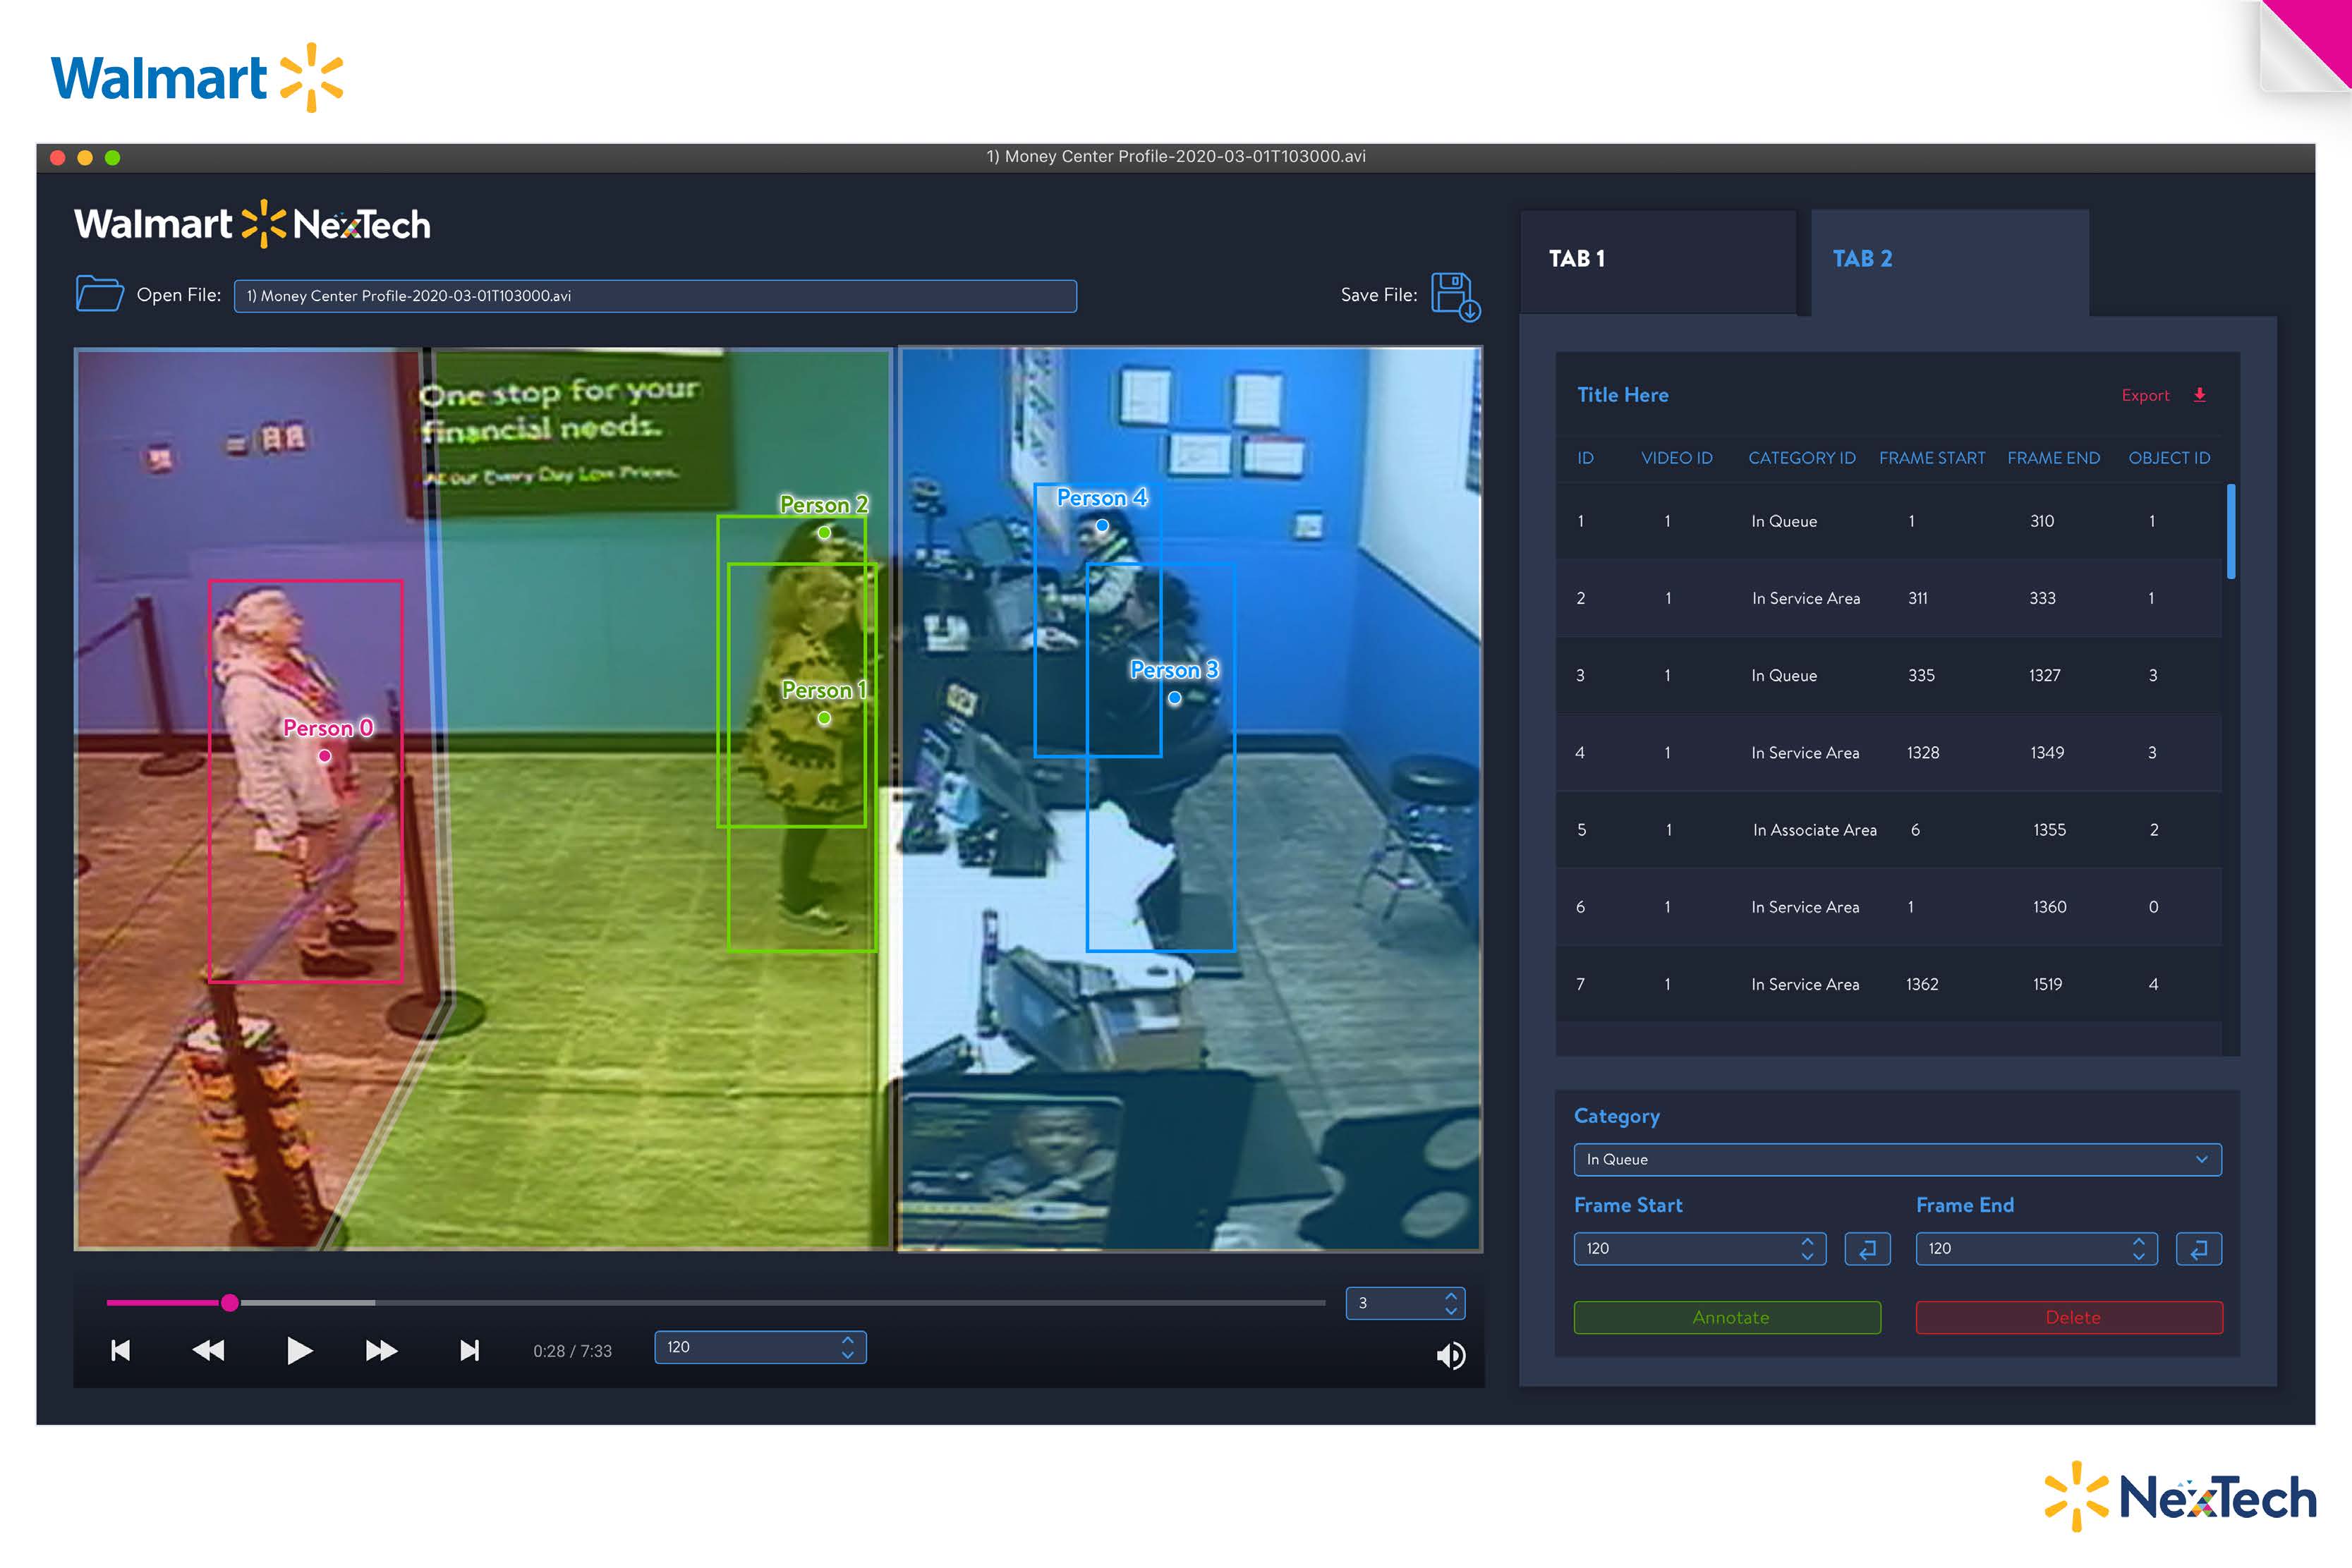
Stadi connects segmented customer activity, elapsed time and associate presence so teams can examine how staffing relates to service demand.
01 / Classify the activity
Waiting customers, people receiving help and associates are distinguished in the video.
02 / Review the session
Review customer timing alongside associate coverage to evaluate waiting, service throughput and staffing needs.
05 / Results & business value
What changed through the work.
A computer-vision analysis workspace connecting customer wait and service times with associate coverage. Stadi gave the team a way to evaluate departmental resource allocation and the time needed to serve customers.
Why it matters.
Connecting service timing with associate coverage supports demand-based staffing decisions. It gives the operating team a way to examine resource use alongside the customer’s wait.
06 / Reflection
Lessons for future projects.
Keep timing and staffing context together. A queue count alone does not explain whether a department needs more capacity or a different way to organize work.
Let’s talk about your next chapter.
Exploring Senior Director, Head of Design and VP opportunities.