
Walmart · Data Science
Designing analytics around the decisions people make.
Connecting merchant and operator workflows with shared data-science platform patterns.
AI leadership noteGive each model a decision to support
Original approach
Partnered with legal and compliance teams on the Walmart data-science work. The work connected internal data-science capabilities to store and merchandising tools, supported by shared interface and visualization patterns.
What could change today
Bring operators and data scientists together around a single decision from each application. Define what the model returns, when a person must review it and what the operator can do if the input is incomplete.
Workflow excerpt. The numbered steps show the same part of the journey in each version. The full project includes work beyond this comparison.
Original workflow
- Understand the decision
- Shape the interface
- Build shared patterns
- Review adoption
Proposed workflow with AI
- Define the store decision and its operator with data science.
- Prototype an interface that shows the prediction and its uncertainty.
- Test a reusable evidence-and-review pattern across applications.
- Review adoption and errors with operators before expanding use.
Team and responsibilities
The original team had eight people, including four direct reports. For a new workflow, pair a data scientist with a store operator to review mismatches, then bring engineering in to fix how the tool presents uncertain results.
How to test the change
Review errors by store condition. A good aggregate score can still hide repeated mistakes in one aisle or camera position.
01 / The problem
What needed to change?
The customer need.
Merchants, store operators and data-science teams need internal tools that connect data to understandable operational decisions.
Advanced analytics need an experience that helps people understand and act on the information. A technically correct result can still be difficult to use if its labels, thresholds or presentation do not fit the person’s decision.
The documented work addressed internal AI, machine-learning and data-science platforms, including merchant and operator tools. Shared platform patterns needed to support those distinct workflows.
02 / My accountability
Scope of responsibility.
Guided an eight-person team, including four direct reports, and led UX for Unity, a design system combining design assets with reusable production-code components.
My remit included co-design with merchants and store operators, two-year roadmaps and cross-functional governance. The platform work belonged to a wider team; the adoption result is not attributed solely to my contribution.
The constraint to work through.
Specialized analytical tasks must share consistent terminology, thresholds and interaction patterns without flattening their domain needs.
03 / Evidence & discovery
What informed the work.
Co-designed dashboards with merchants and store operators. Their decision-making informed terminology, thresholds and visual hierarchy, connecting the interface to the work they needed to perform.
That collaboration connected domain-specific needs with shared platform patterns. Used Unity to support consistency across tools while preserving the information and interaction needs of each workflow.
Understand the decision
Work with merchants and store operators on the use context.
Shape the interface
Align labels, thresholds and hierarchy with the task.
Build shared patterns
Connect the design language with reusable Unity components.
Review adoption
Evaluate broader platform use and identify the next improvements.
04 / Leadership decisions
Where my judgment mattered.
Use the language of the operating decision.
Co-designed dashboards with the people using them, aligning terminology and thresholds with how merchants and operators made decisions.
Leadership implication: platform consistency should support domain understanding, rather than erase it.Make data-rich interfaces navigable.
The case describes guided flows, high-information-density patterns and making model assumptions, confidence and data lineage visible to build understanding of recommendations.
Leadership implication: a dashboard must help a person interpret information before asking them to act.Pair shared design with reusable code.
Unity connected design assets with production-code components, while roadmaps and cross-functional governance coordinated platform direction.
Leadership implication: reusable patterns need to work in implementation and across multiple product contexts.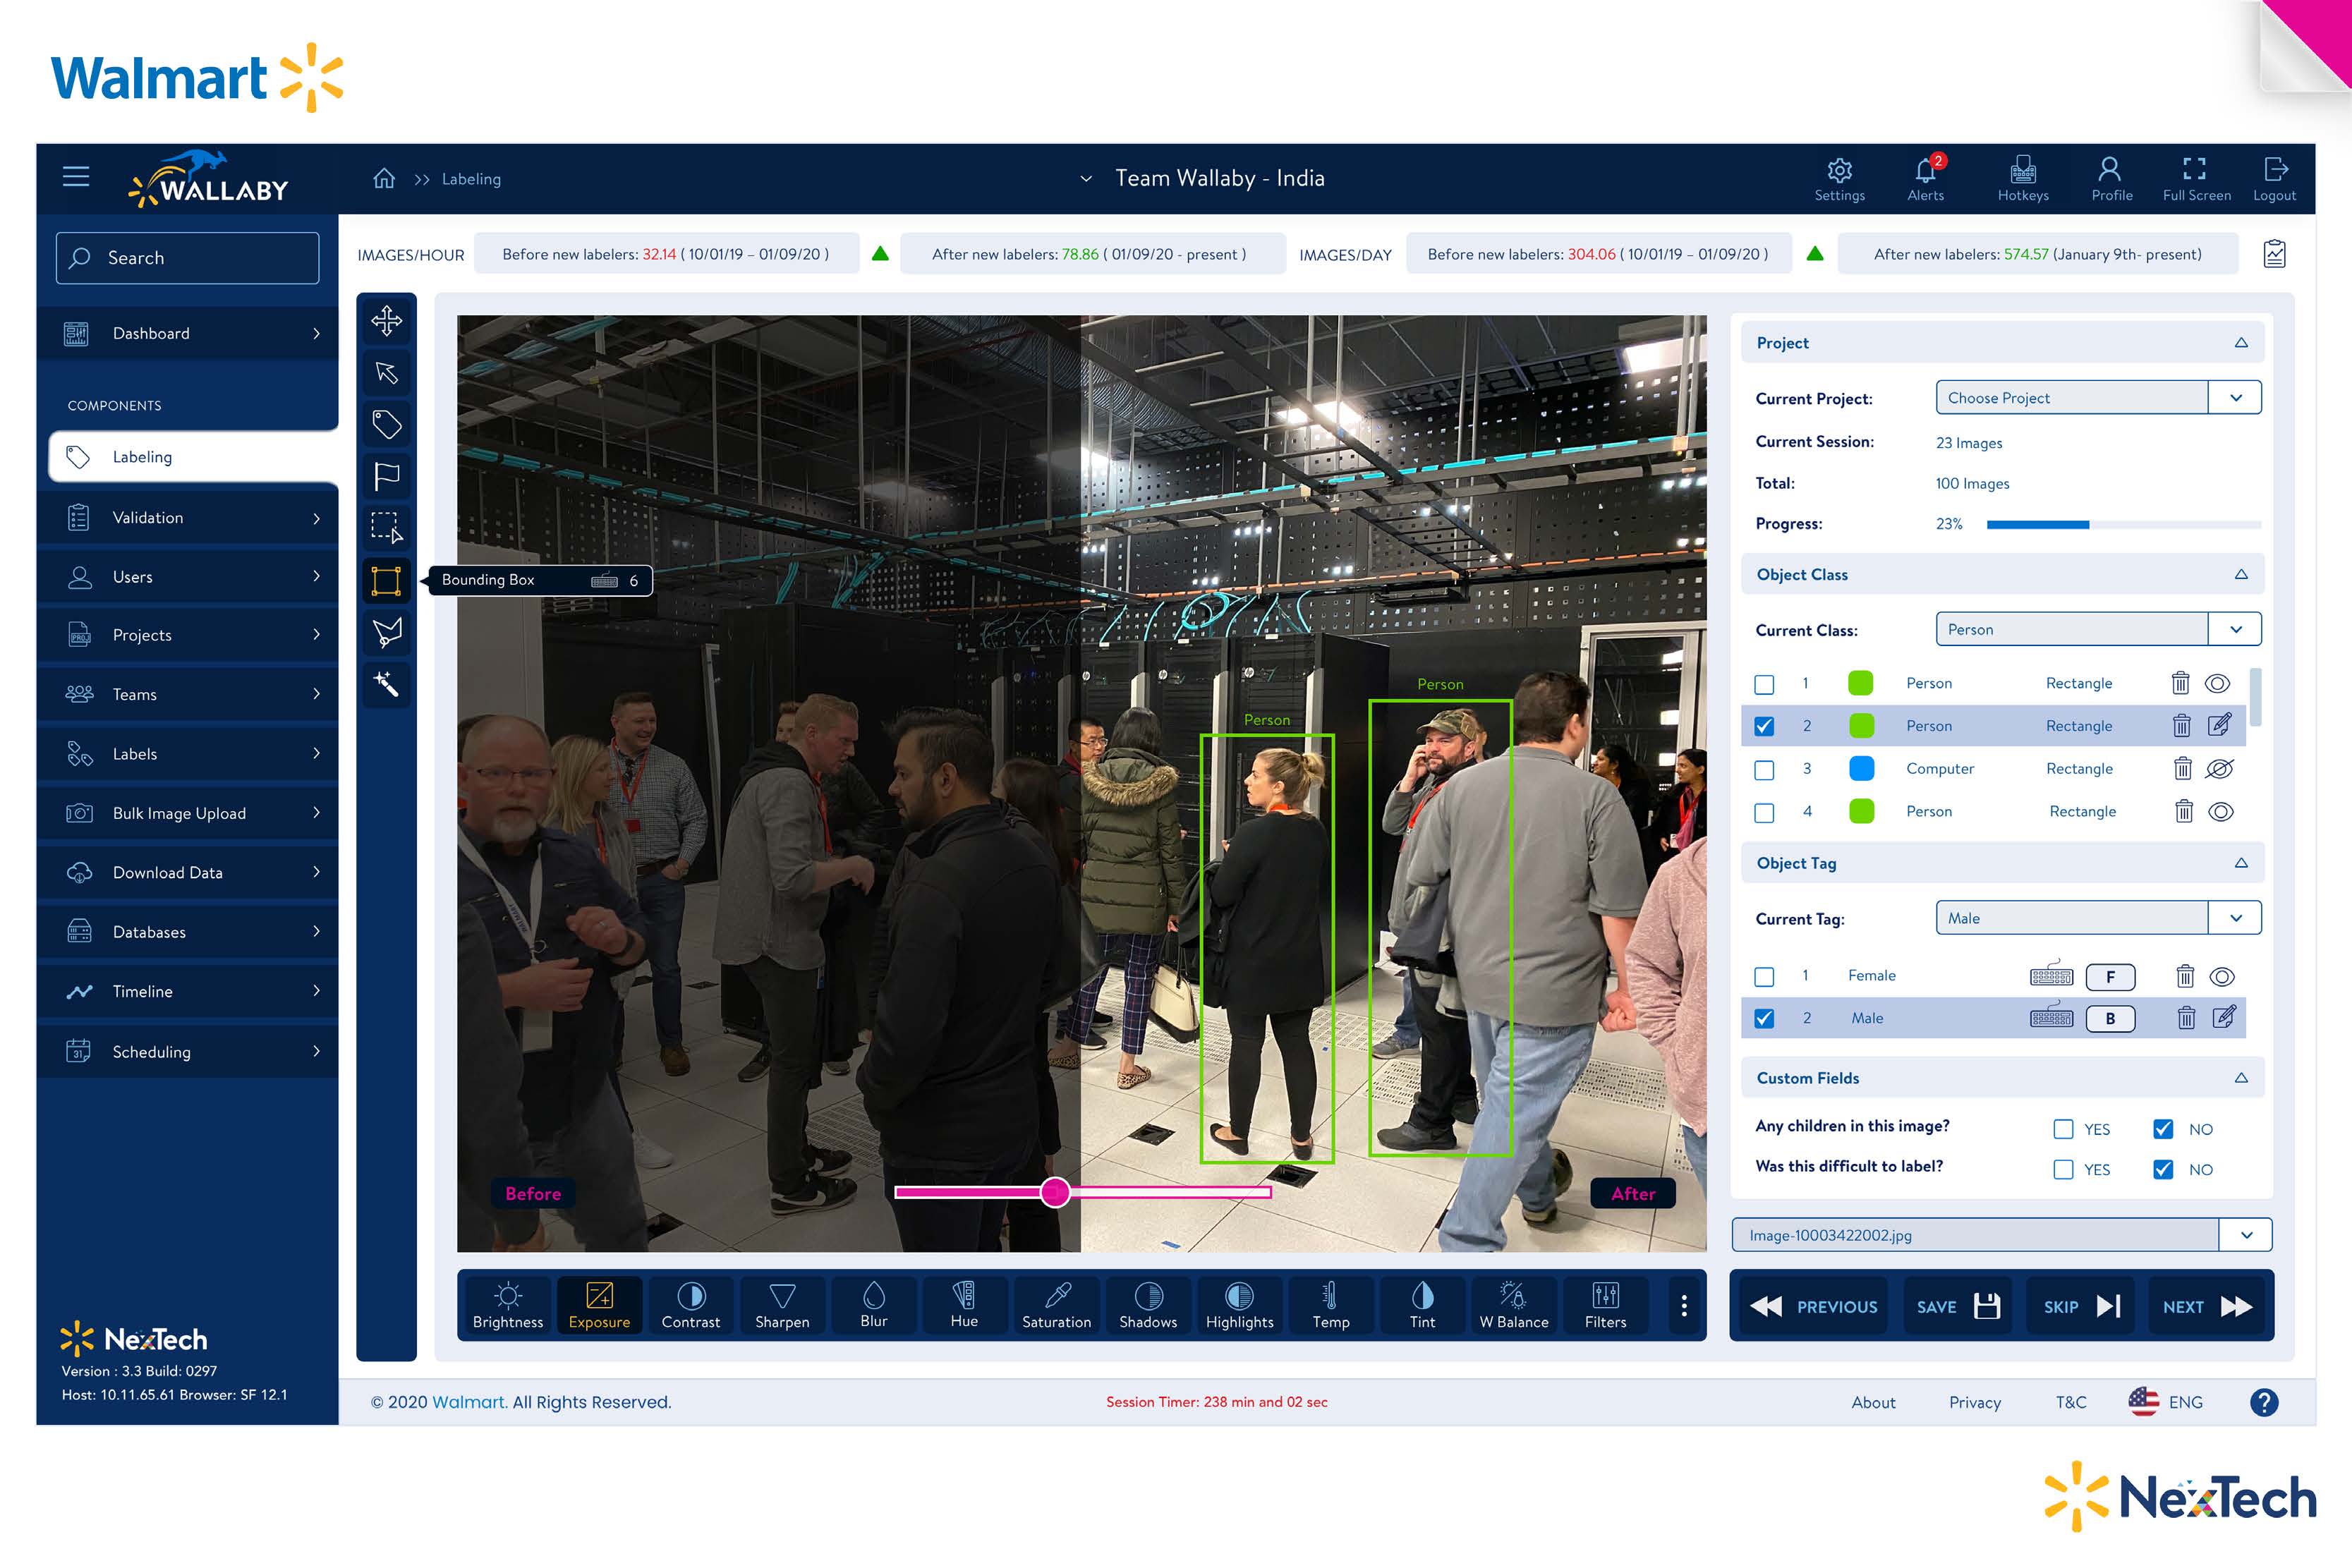
Image context, annotation controls and structured labels in a single workspace.
05 / Application & people
How the work reached delivery.
Partnered with legal and compliance teams on the Walmart data-science work. The work connected internal data-science capabilities to store and merchandising tools, supported by shared interface and visualization patterns.
The broader role also included an AR smart-store prototype presented to CEO Doug McMillon and an Enterprise Hackathon win. These show innovation breadth; they are separate from the dashboard co-design and platform-adoption story.
Inside the product work
Different decisions. A shared foundation.
A closer look at the internal applications, from visual annotation to store-level operations.
Data Science Design System (Unity)
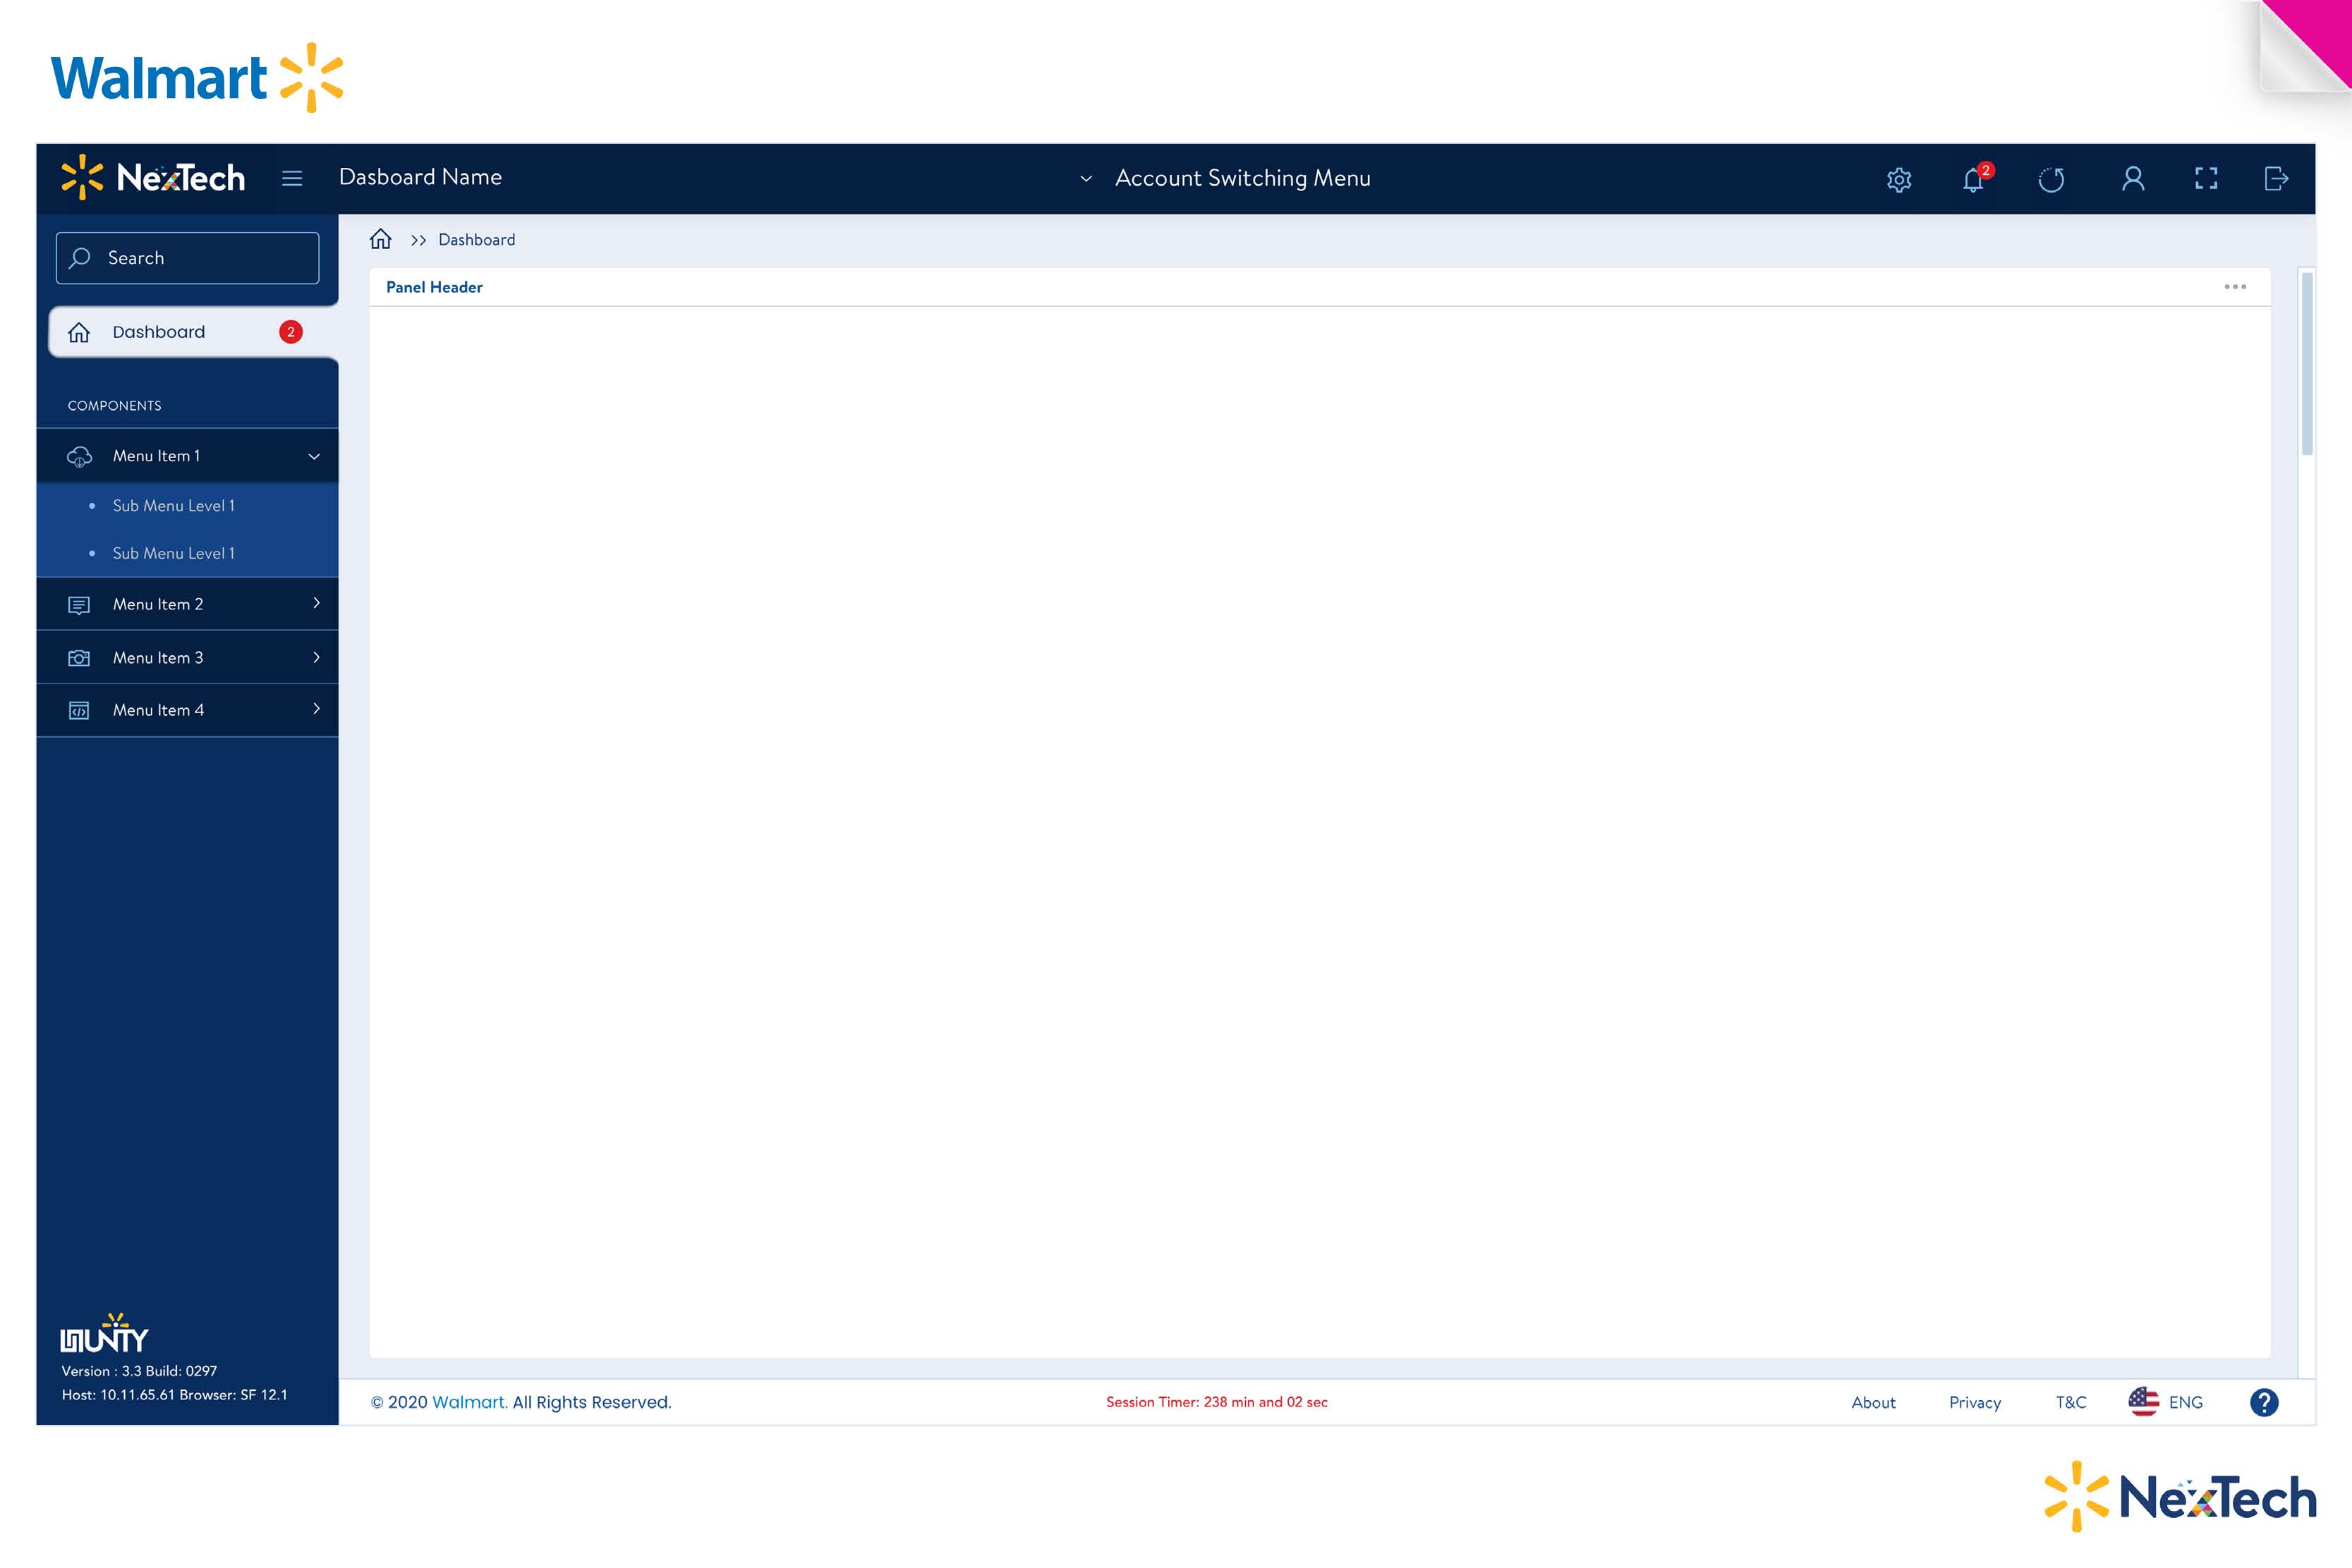
Unity combined shared design assets with reusable production-code components for Data Science and Analytics tools. Led UX direction, partnering with engineering on a common implementation foundation.
The system connected navigation, layouts, visualization patterns and component standards across applications. Adoption and governance sat alongside the library, supported by cross-functional roadmaps.
Wallaby · A workspace for training data.
Designed the original Wallaby application, which the team used to label 300,000 firearm images for computer-vision safety research. The work needed images to become structured, reviewable labels. Wallaby brings collection navigation, visual context and annotation controls into a dedicated workspace for the people preparing that data.
The design focus is continuity: enter the platform, find the relevant collection, inspect an image and keep the label controls close to the work.
- Find a collection
- Inspect the image
- Apply labels
- Review the annotation
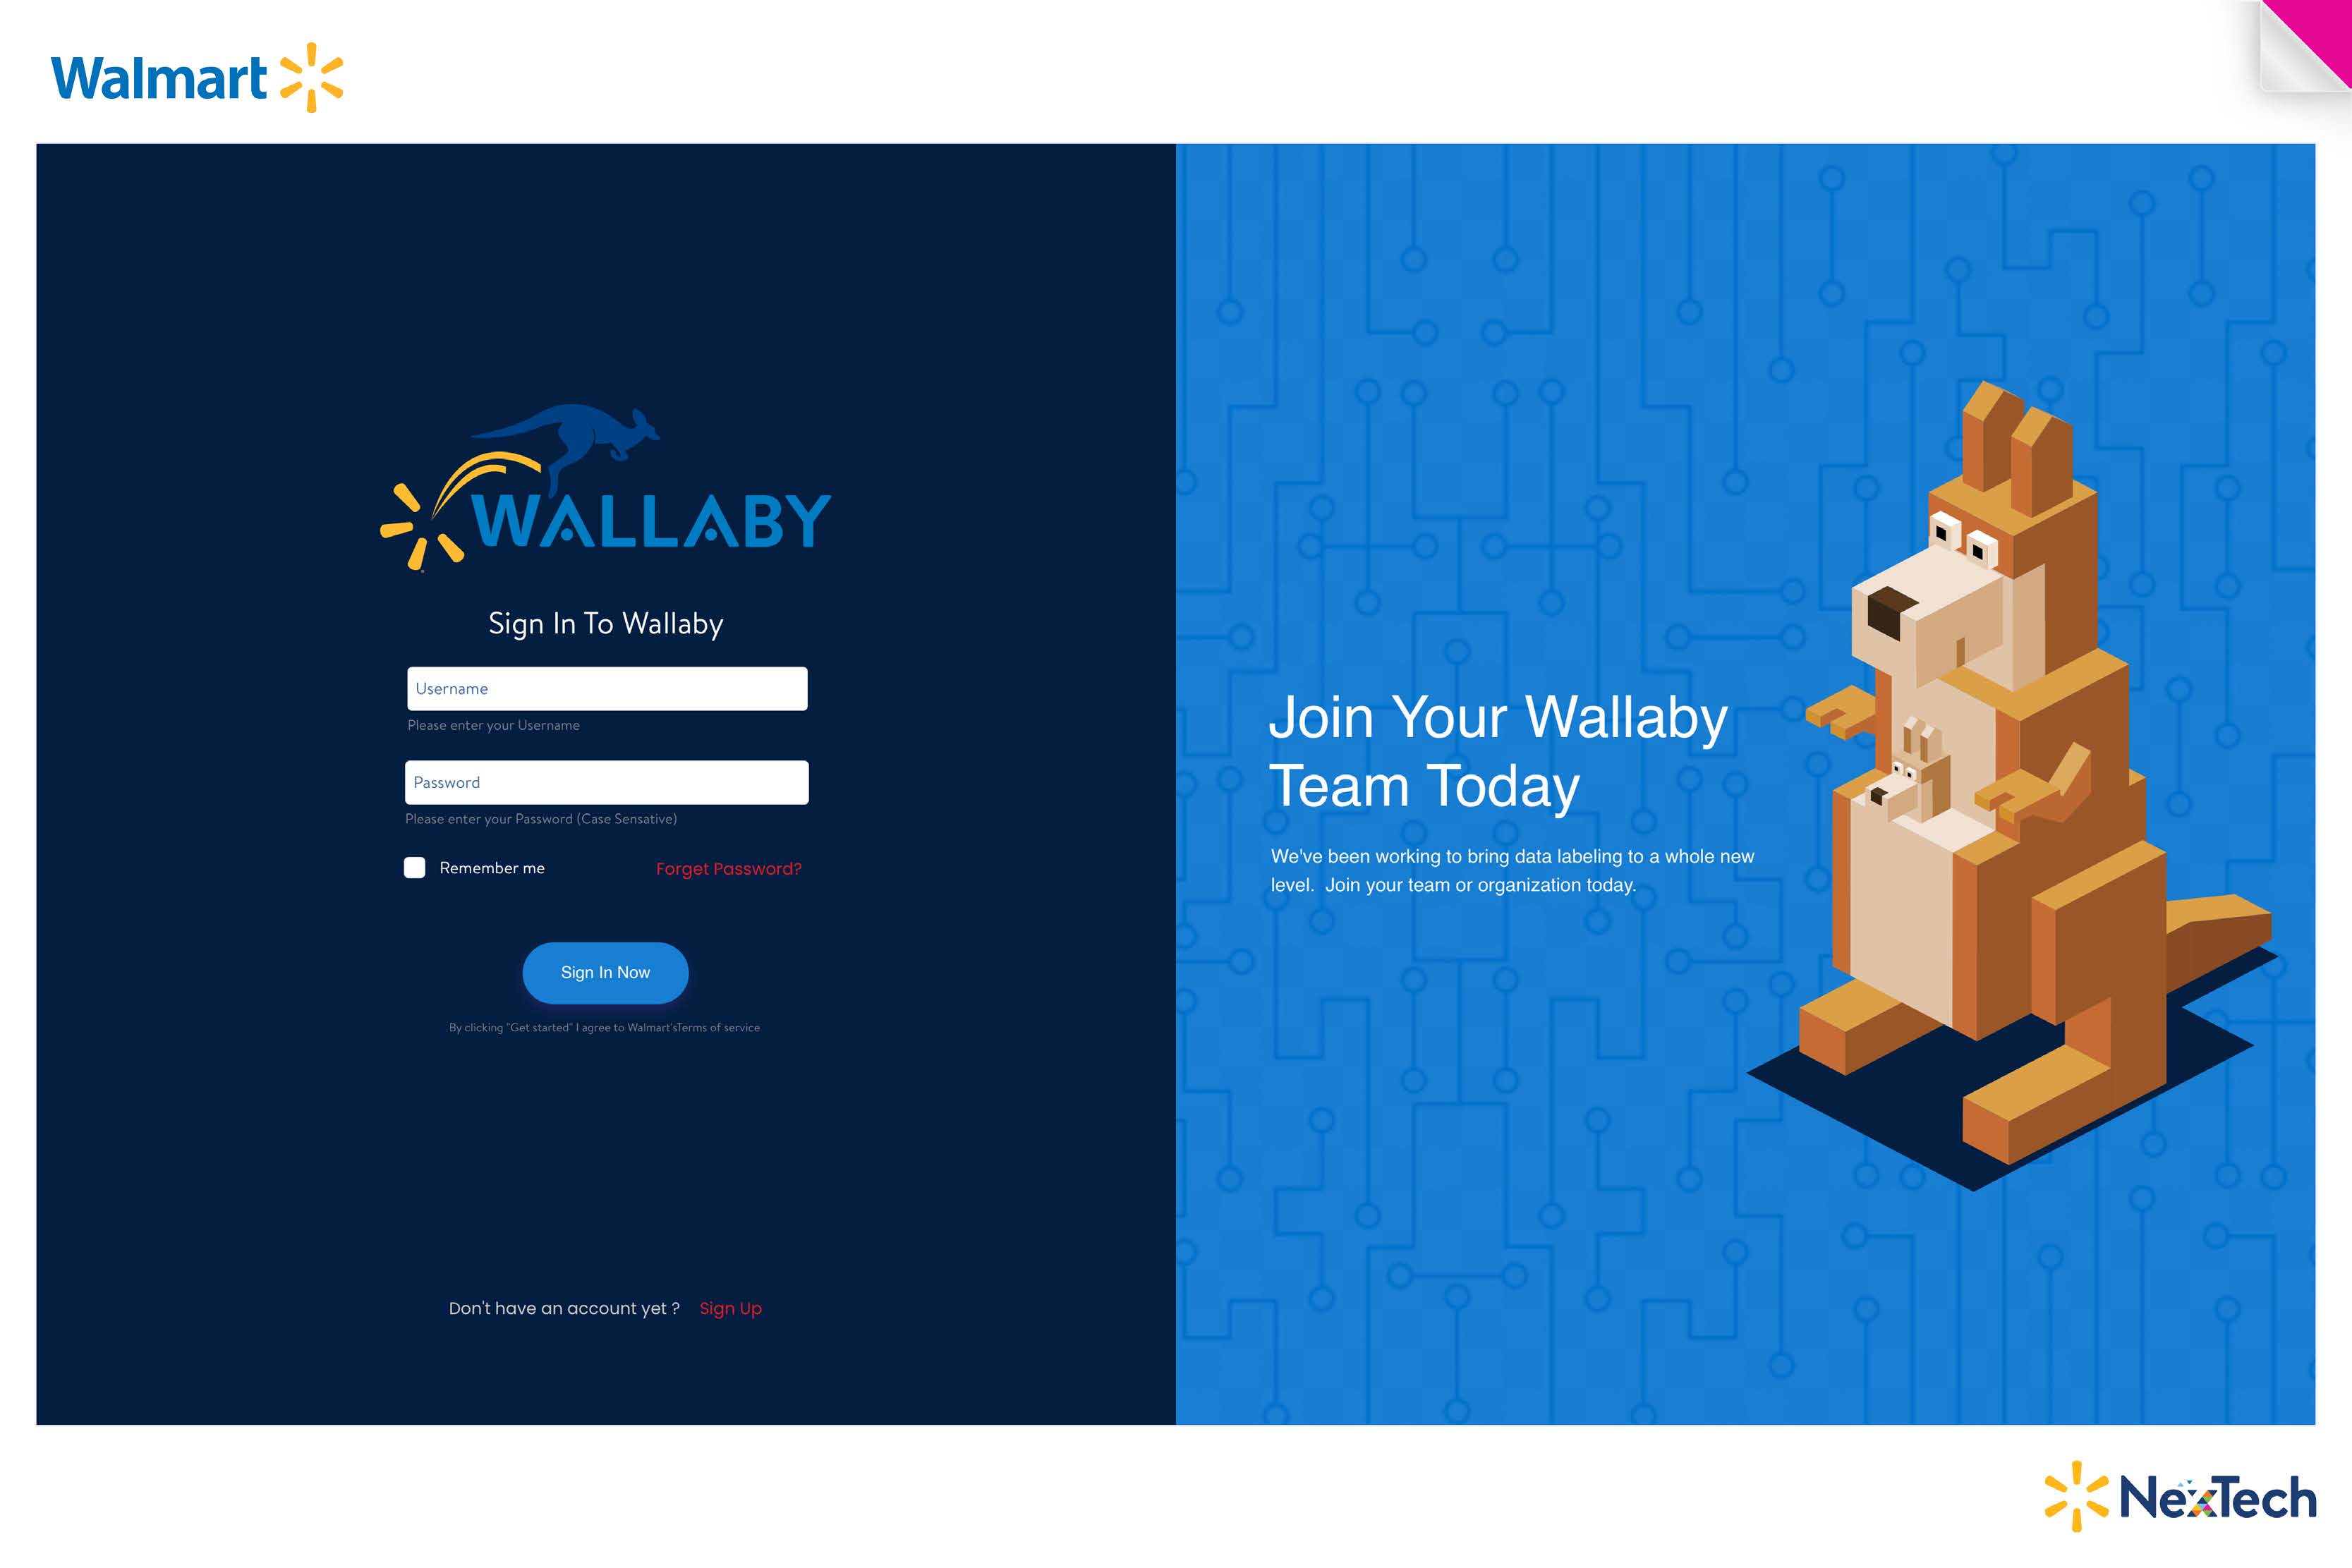
A dedicated entry point for the computer-vision labeling platform.
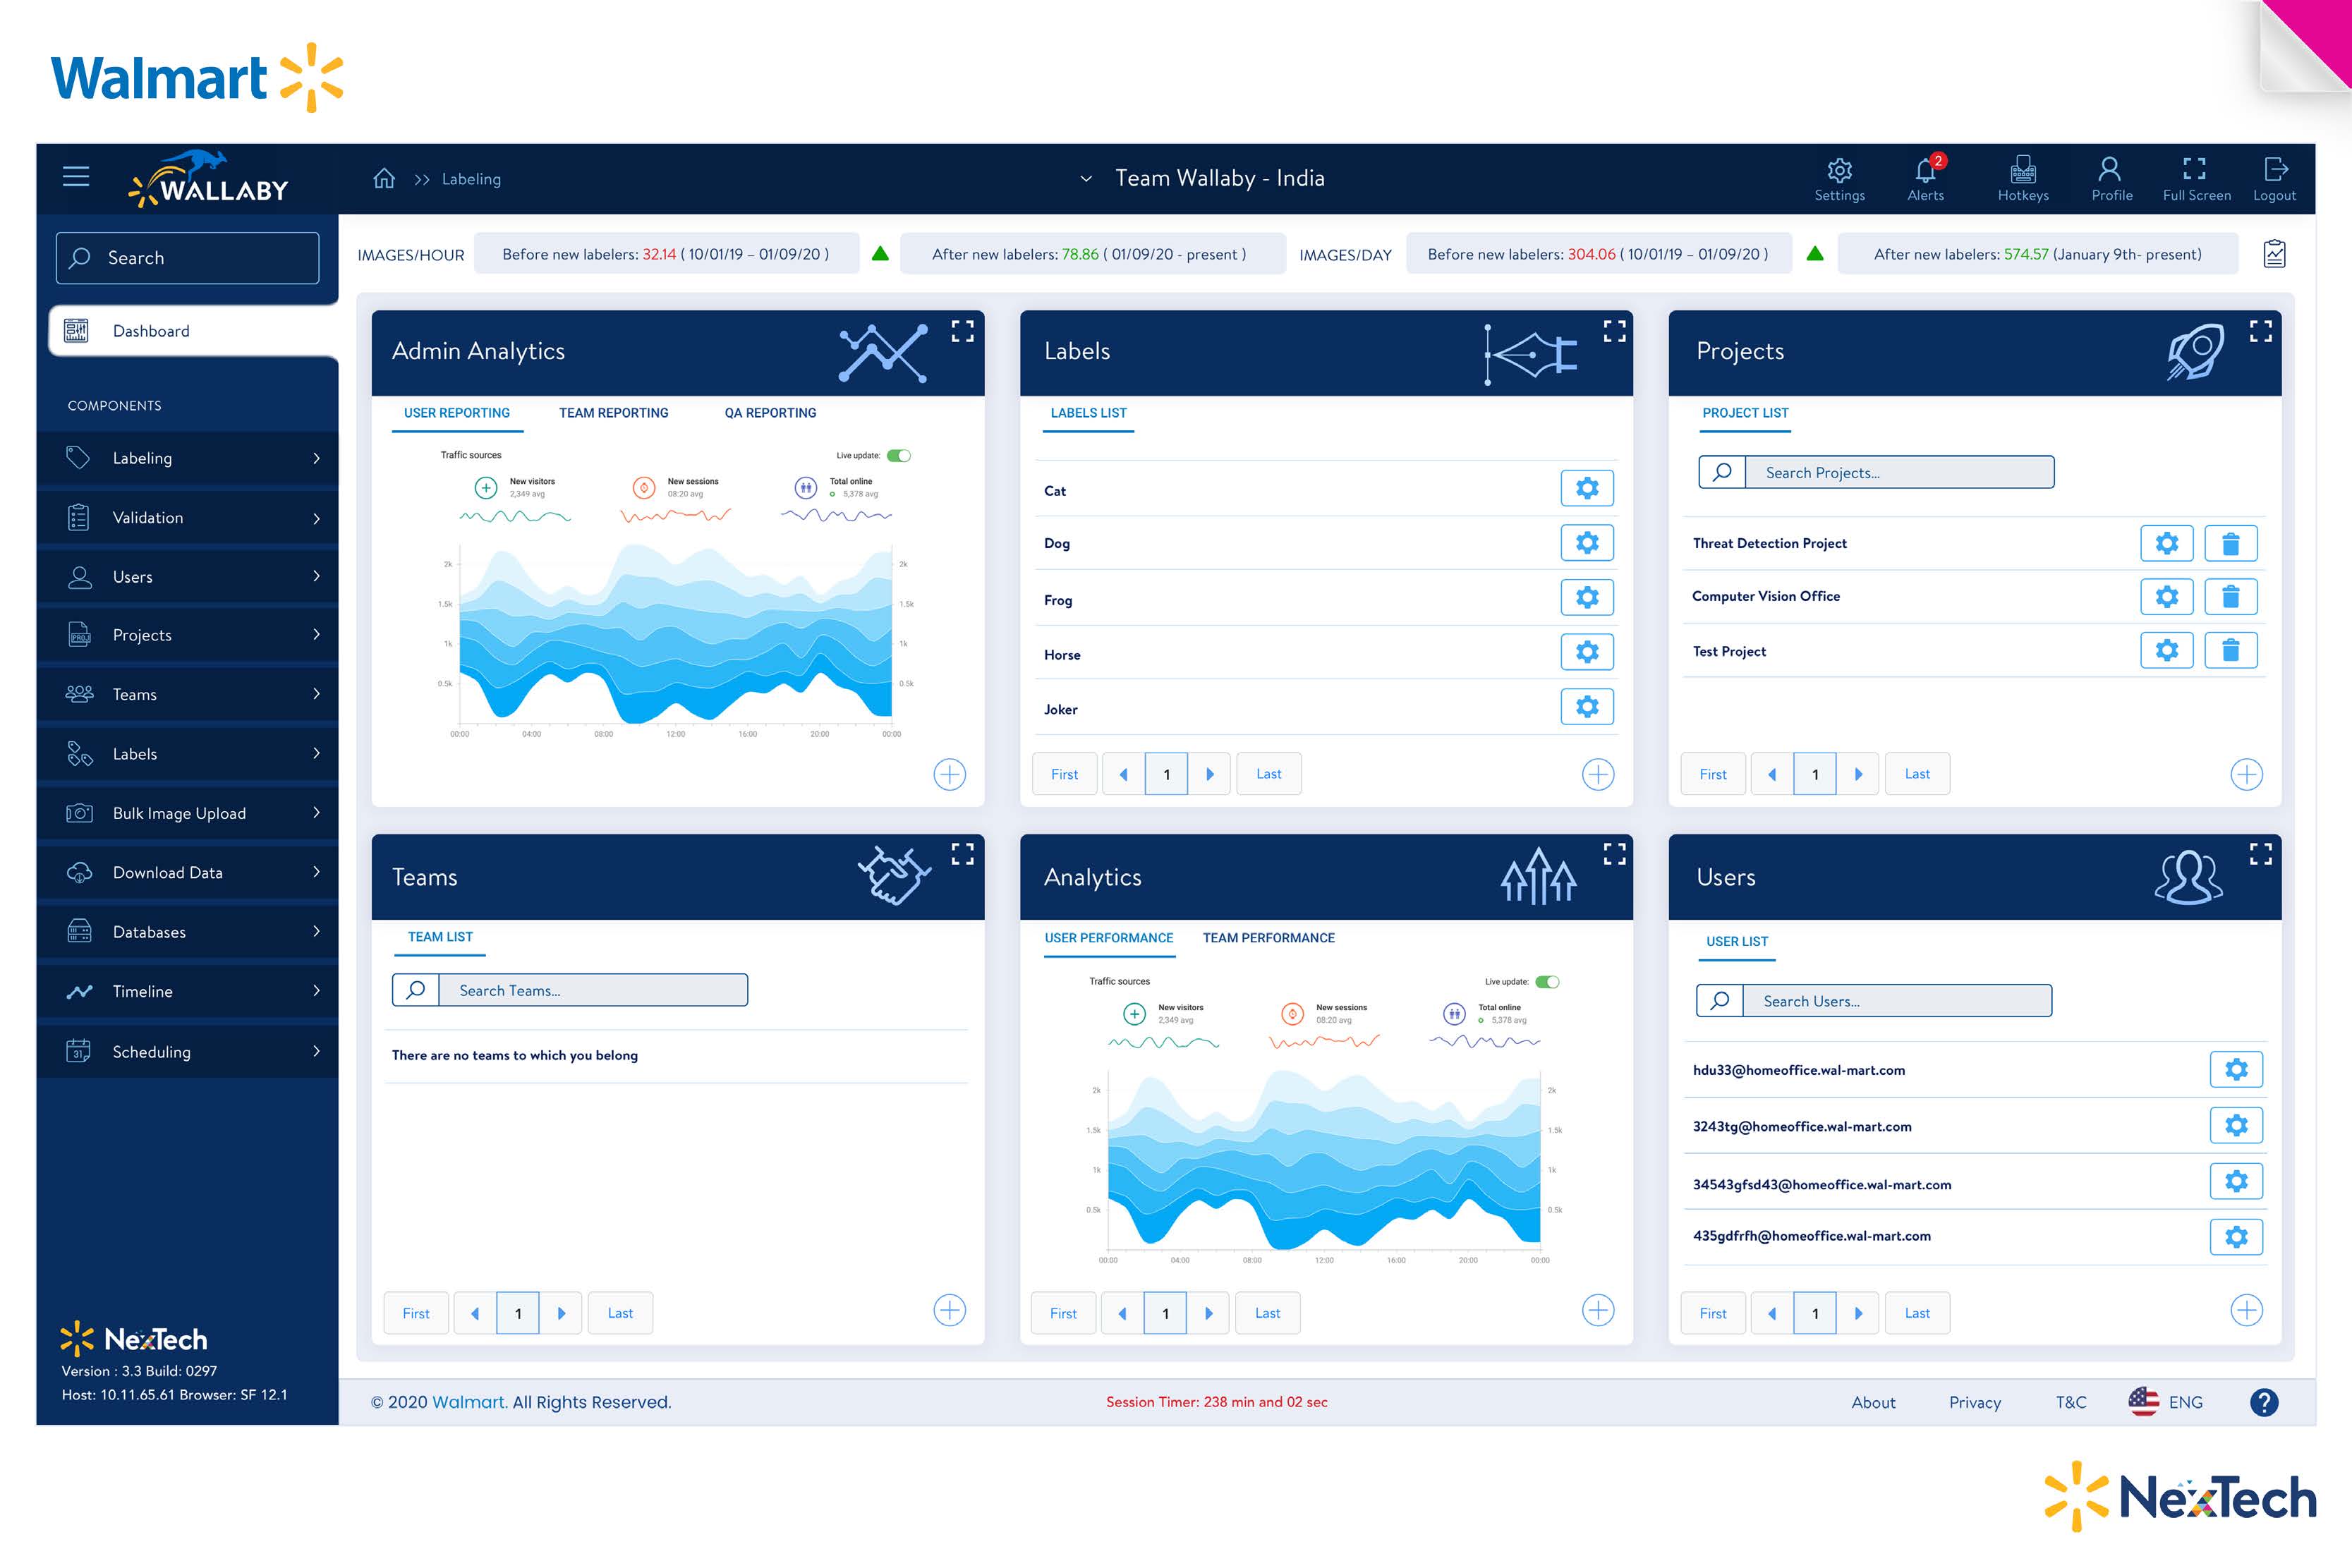
Collections, activity and contribution information organized in a shared application shell.
Image context, annotation controls and structured labels in a single workspace.
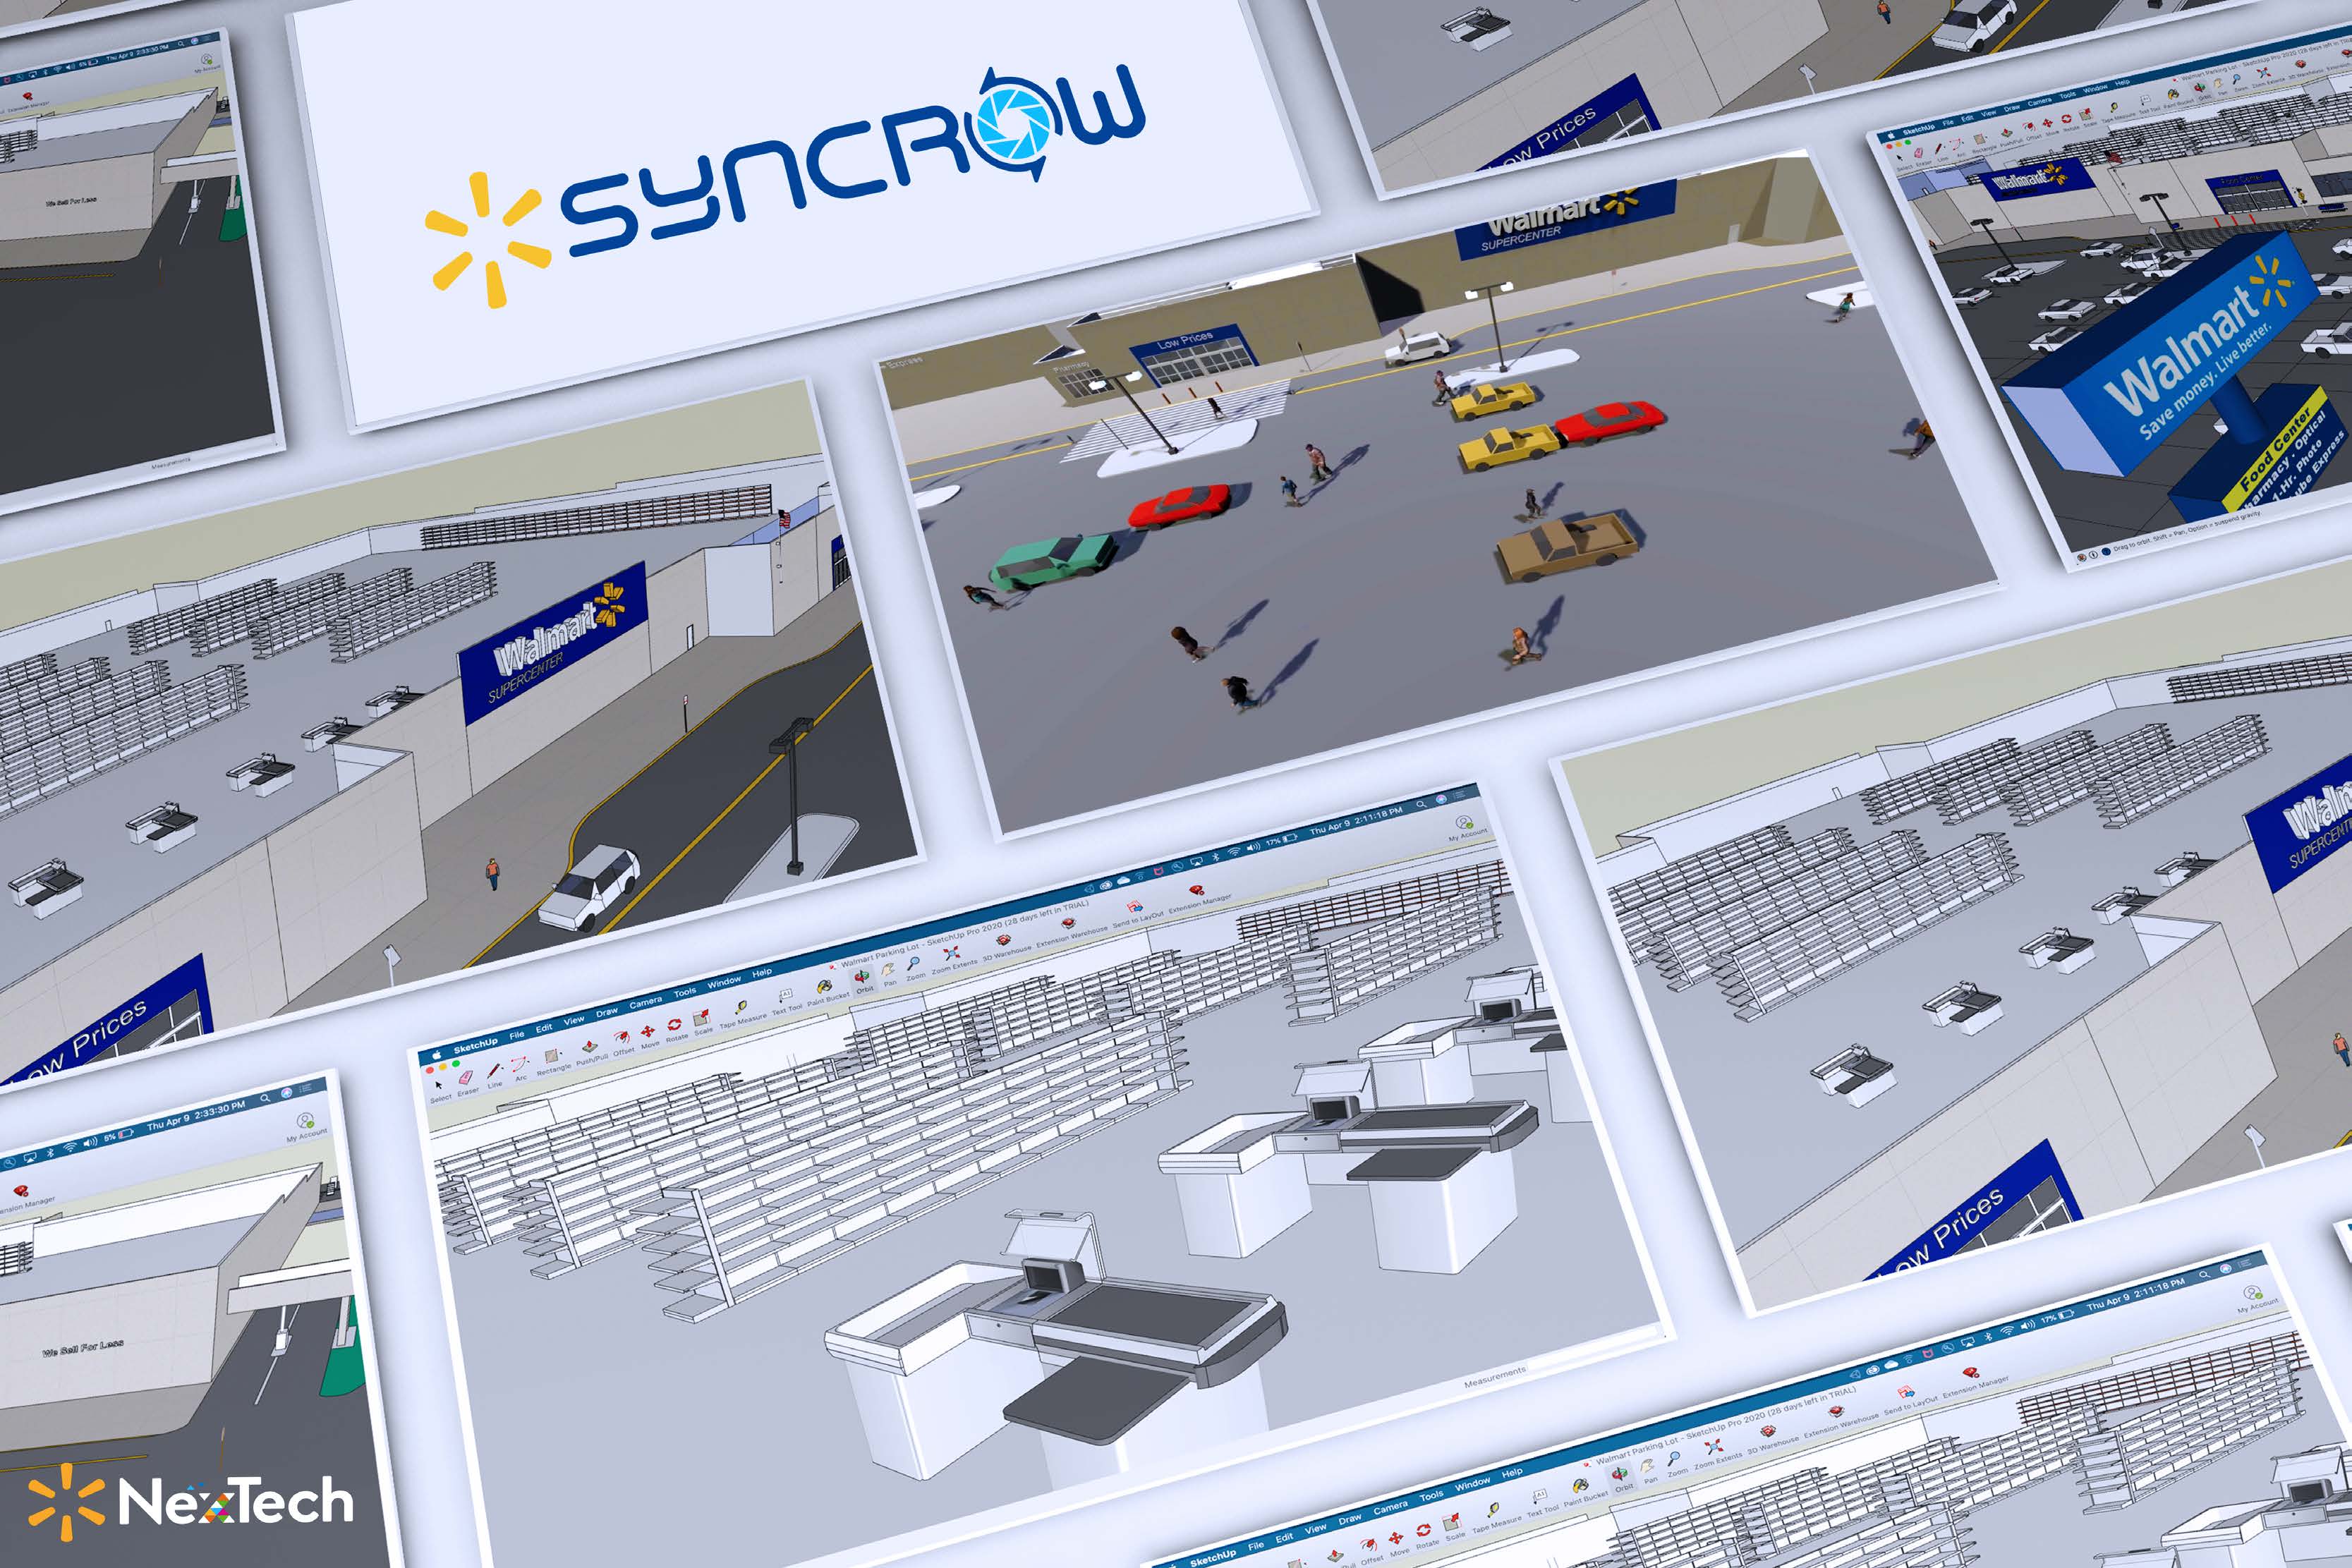
Synchro · Moving scenario research into simulation.
Repeated scenario capture at a mock store brought around 25 staff away from their other work. Our Plano data science team explored a Unity-based 3D environment to vary scenes without repeating that coordination.
Assembled the team, created the 3D models and built the Unity scenes. The data scientists ran the models using Wallaby-labeled data, and we connected that work with the simulation.
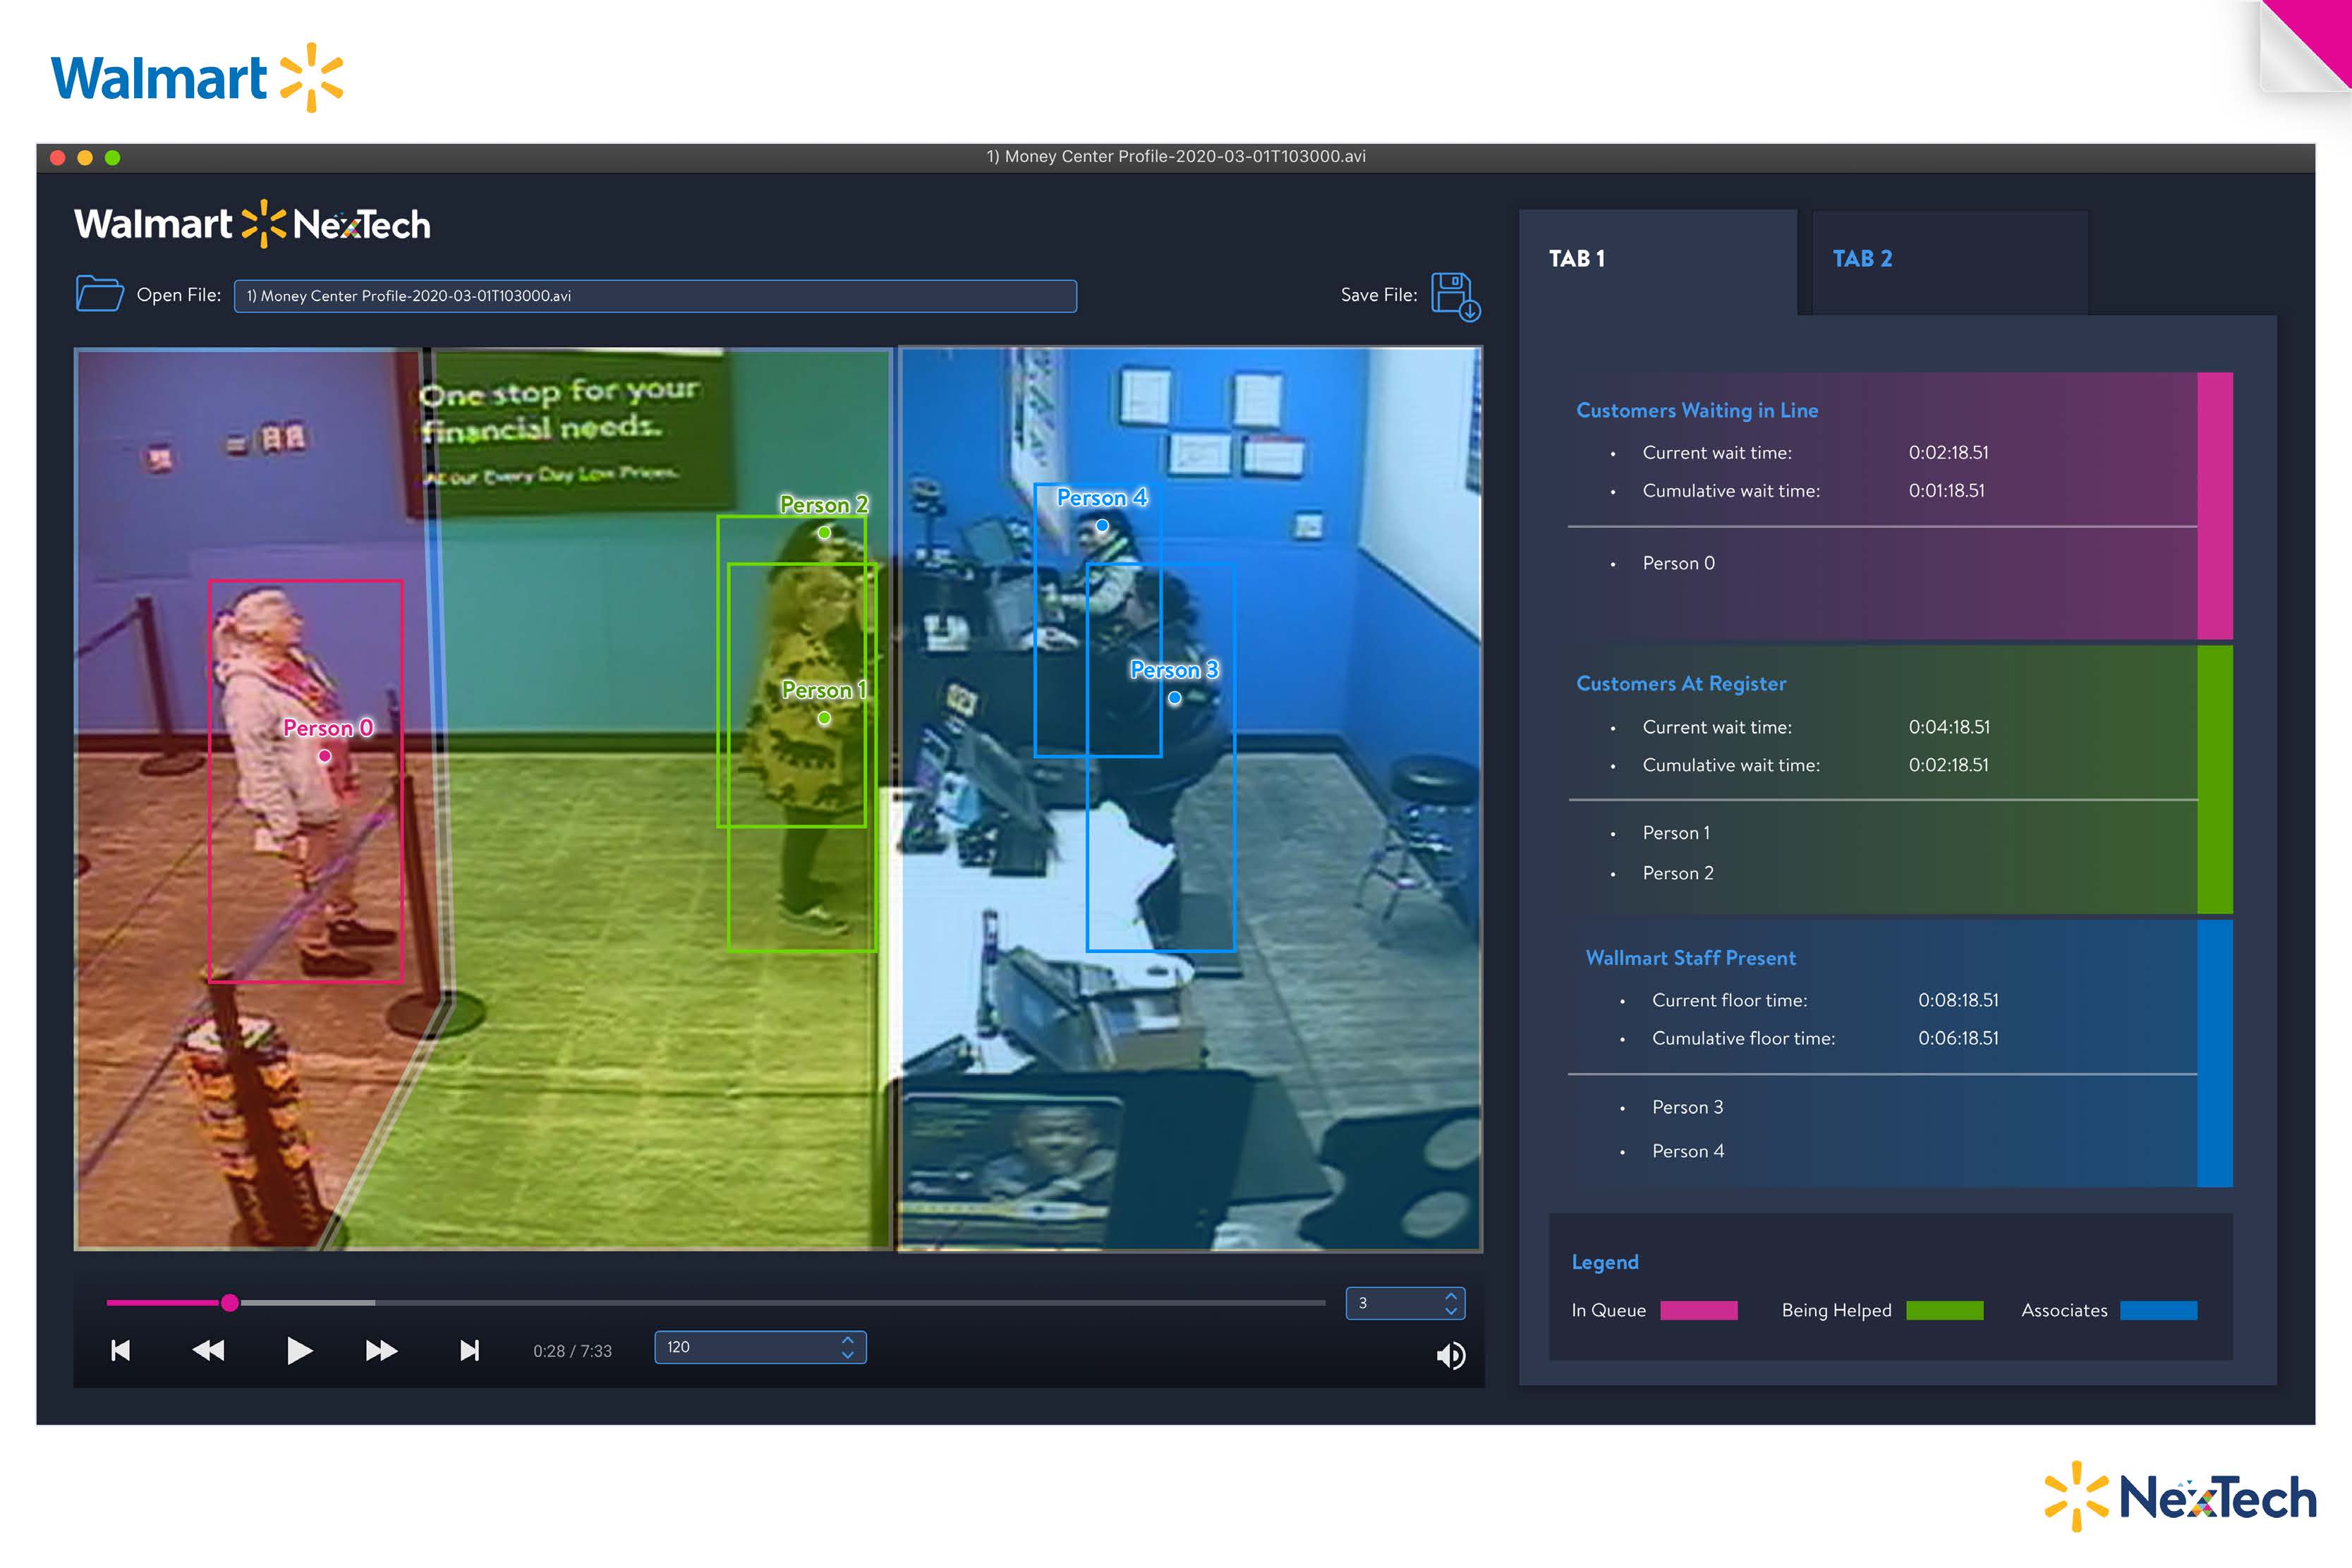
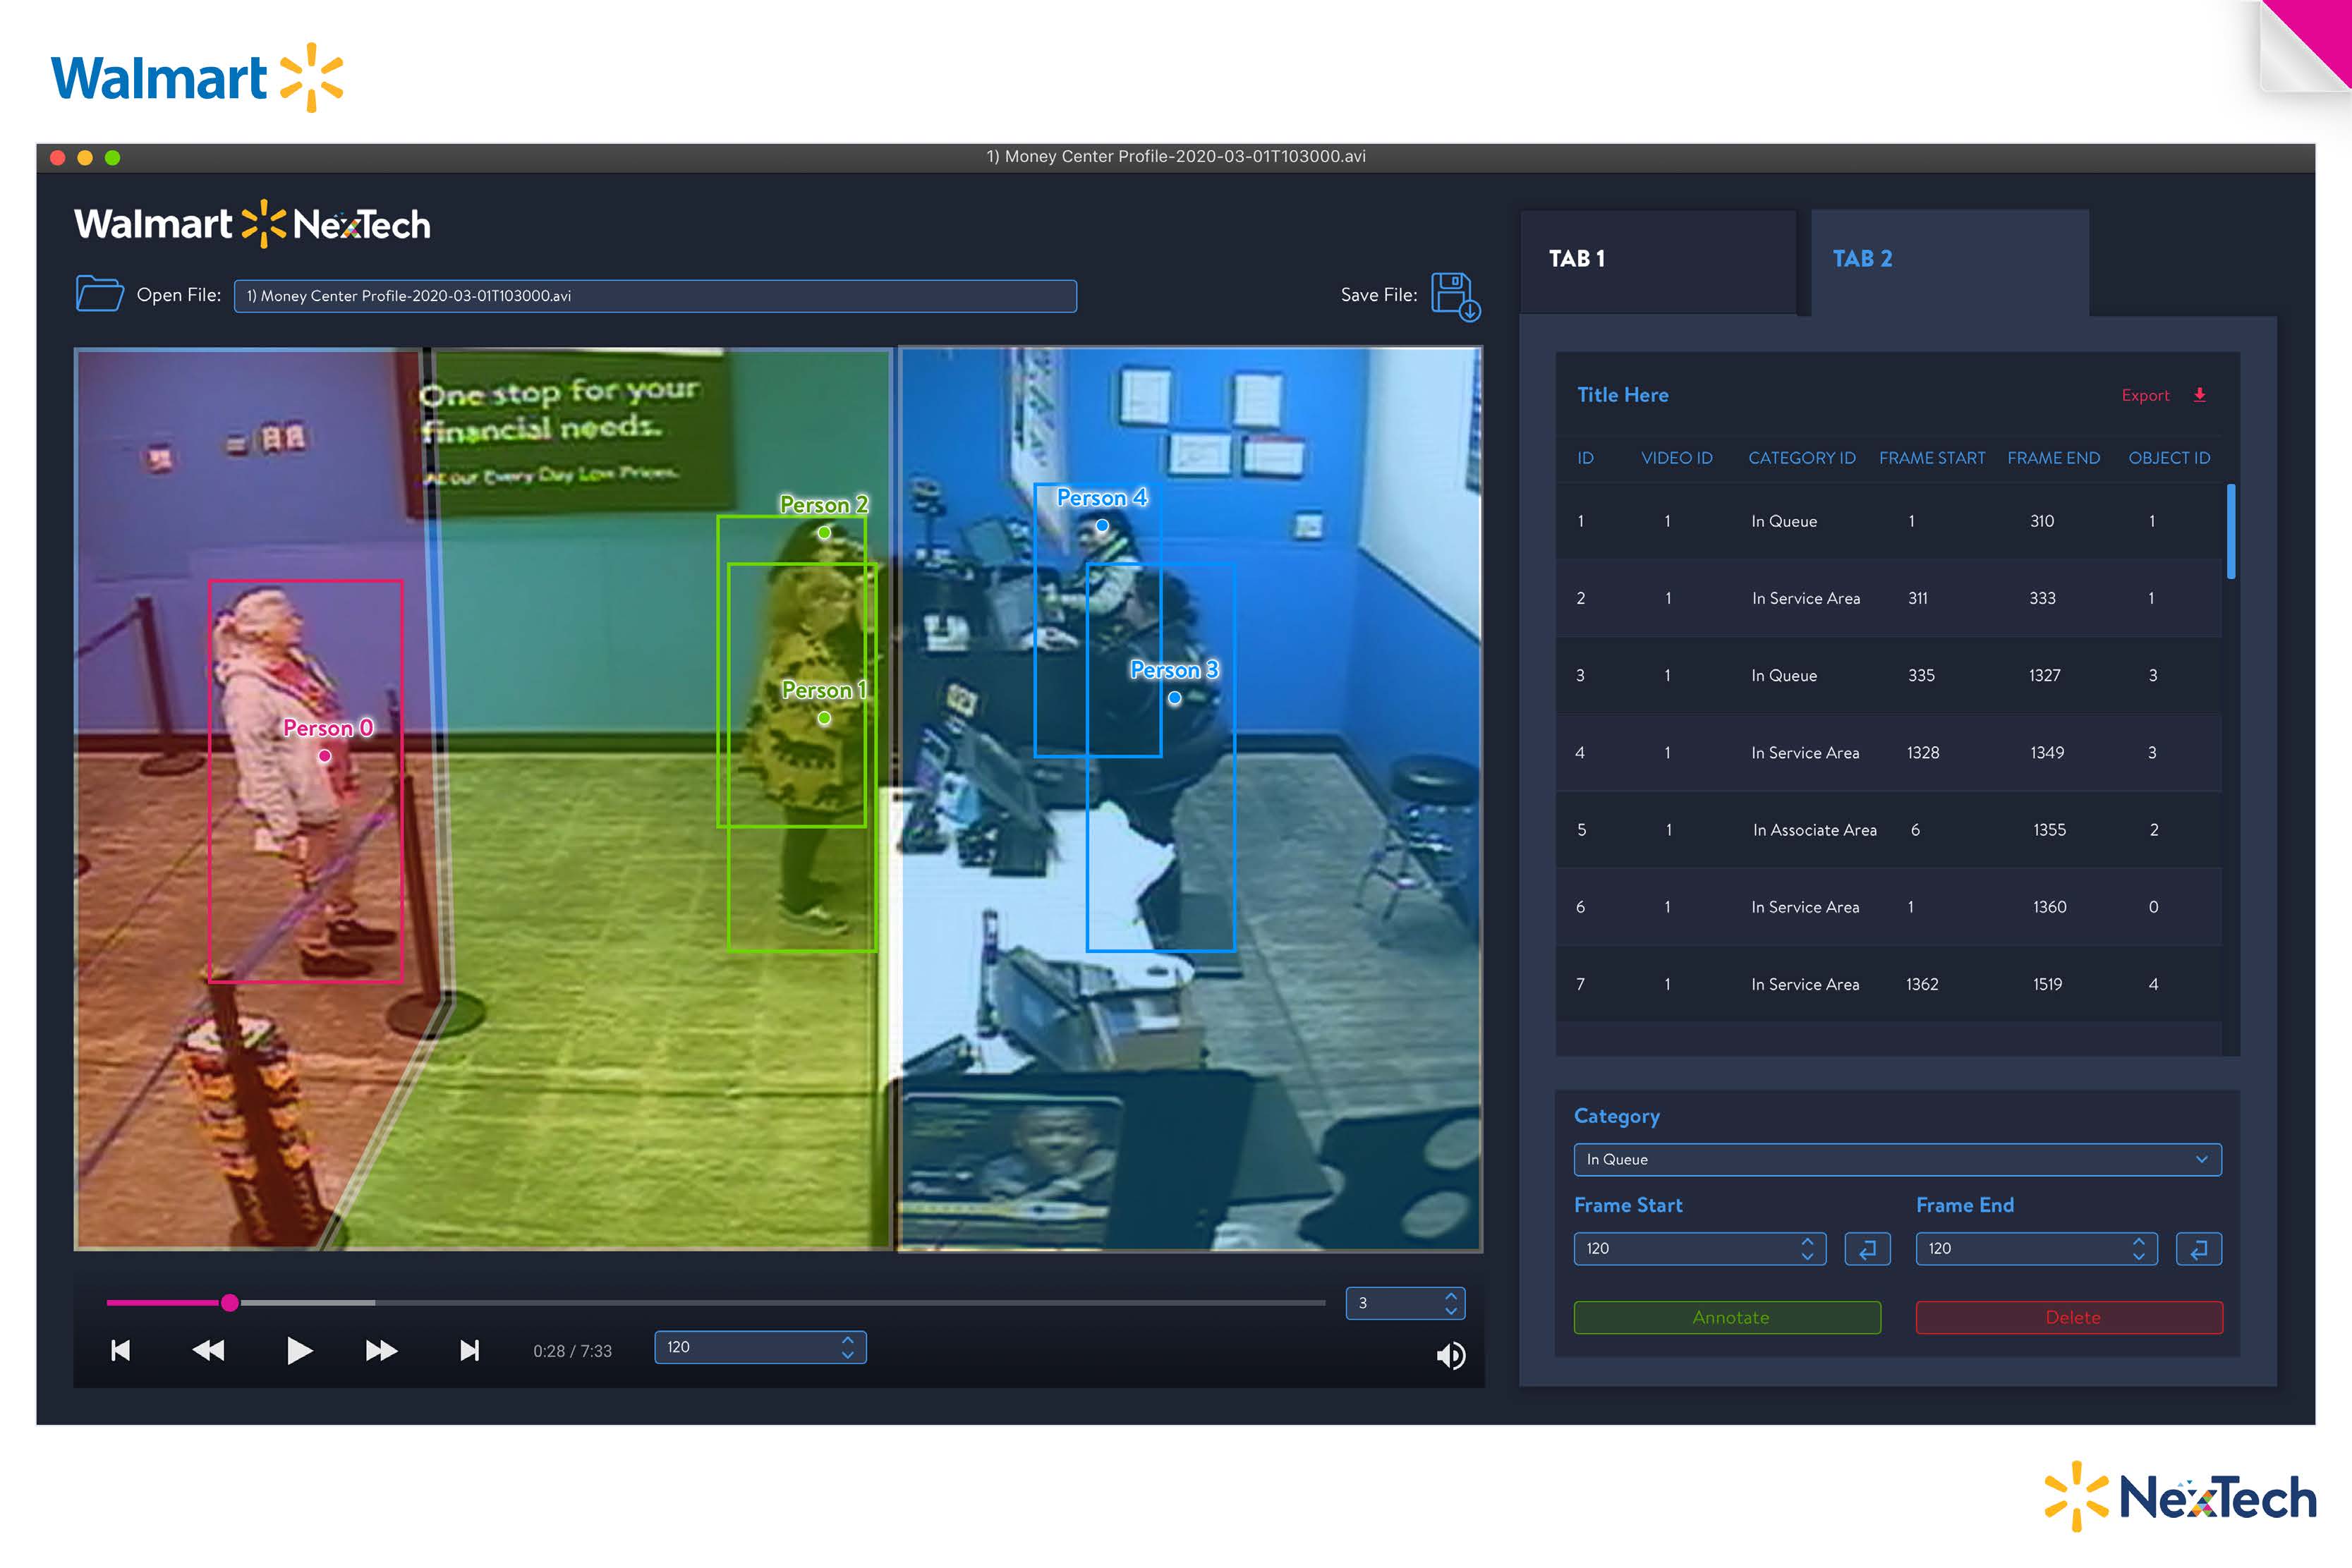
Stadi · Understanding service and staffing.
Stadi uses computer vision to track how many customers are waiting and how long they spend waiting or receiving help. Video annotations distinguish waiting customers, people being served and associates, with timing information alongside the footage.
The purpose is to give customer-service teams a clearer picture of demand, service flow and staffing needs. Associate coverage helps teams evaluate whether fewer staff could serve the same workload. The interface makes that analysis inspectable through playback, category colors, customer counts and elapsed time.
- Review the footage
- Distinguish the states
- Measure time and count
- Inspect the service pattern
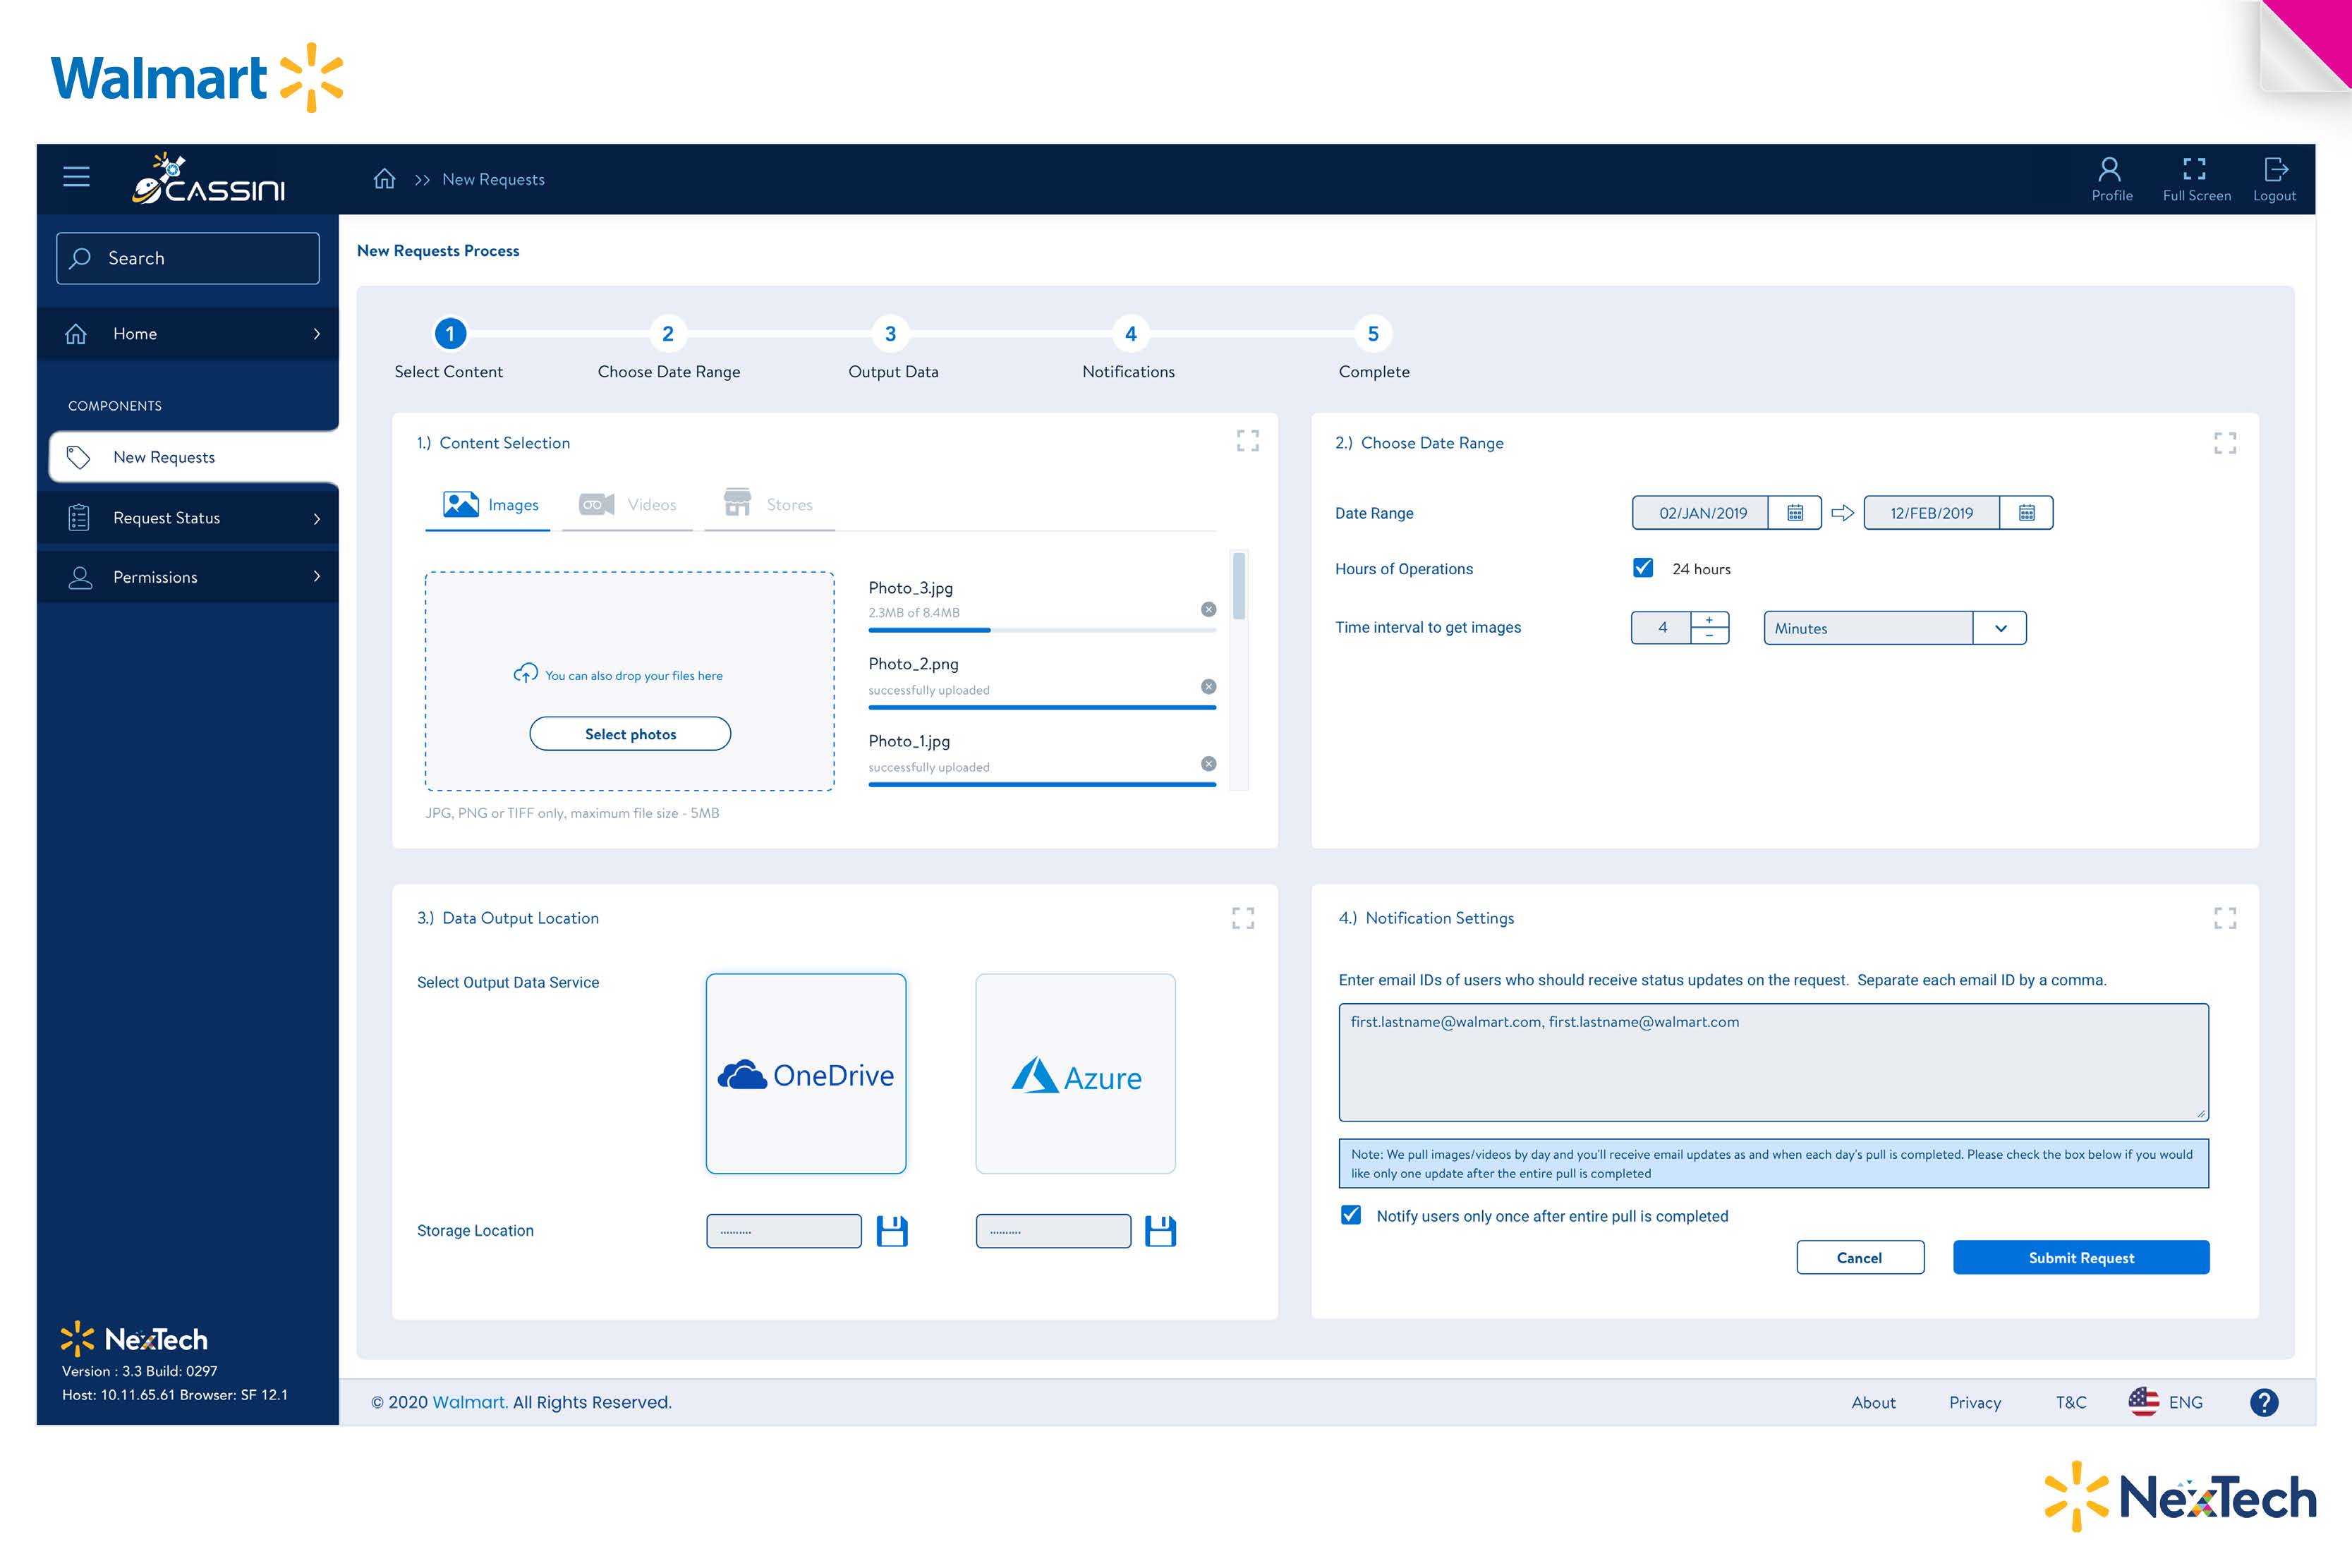
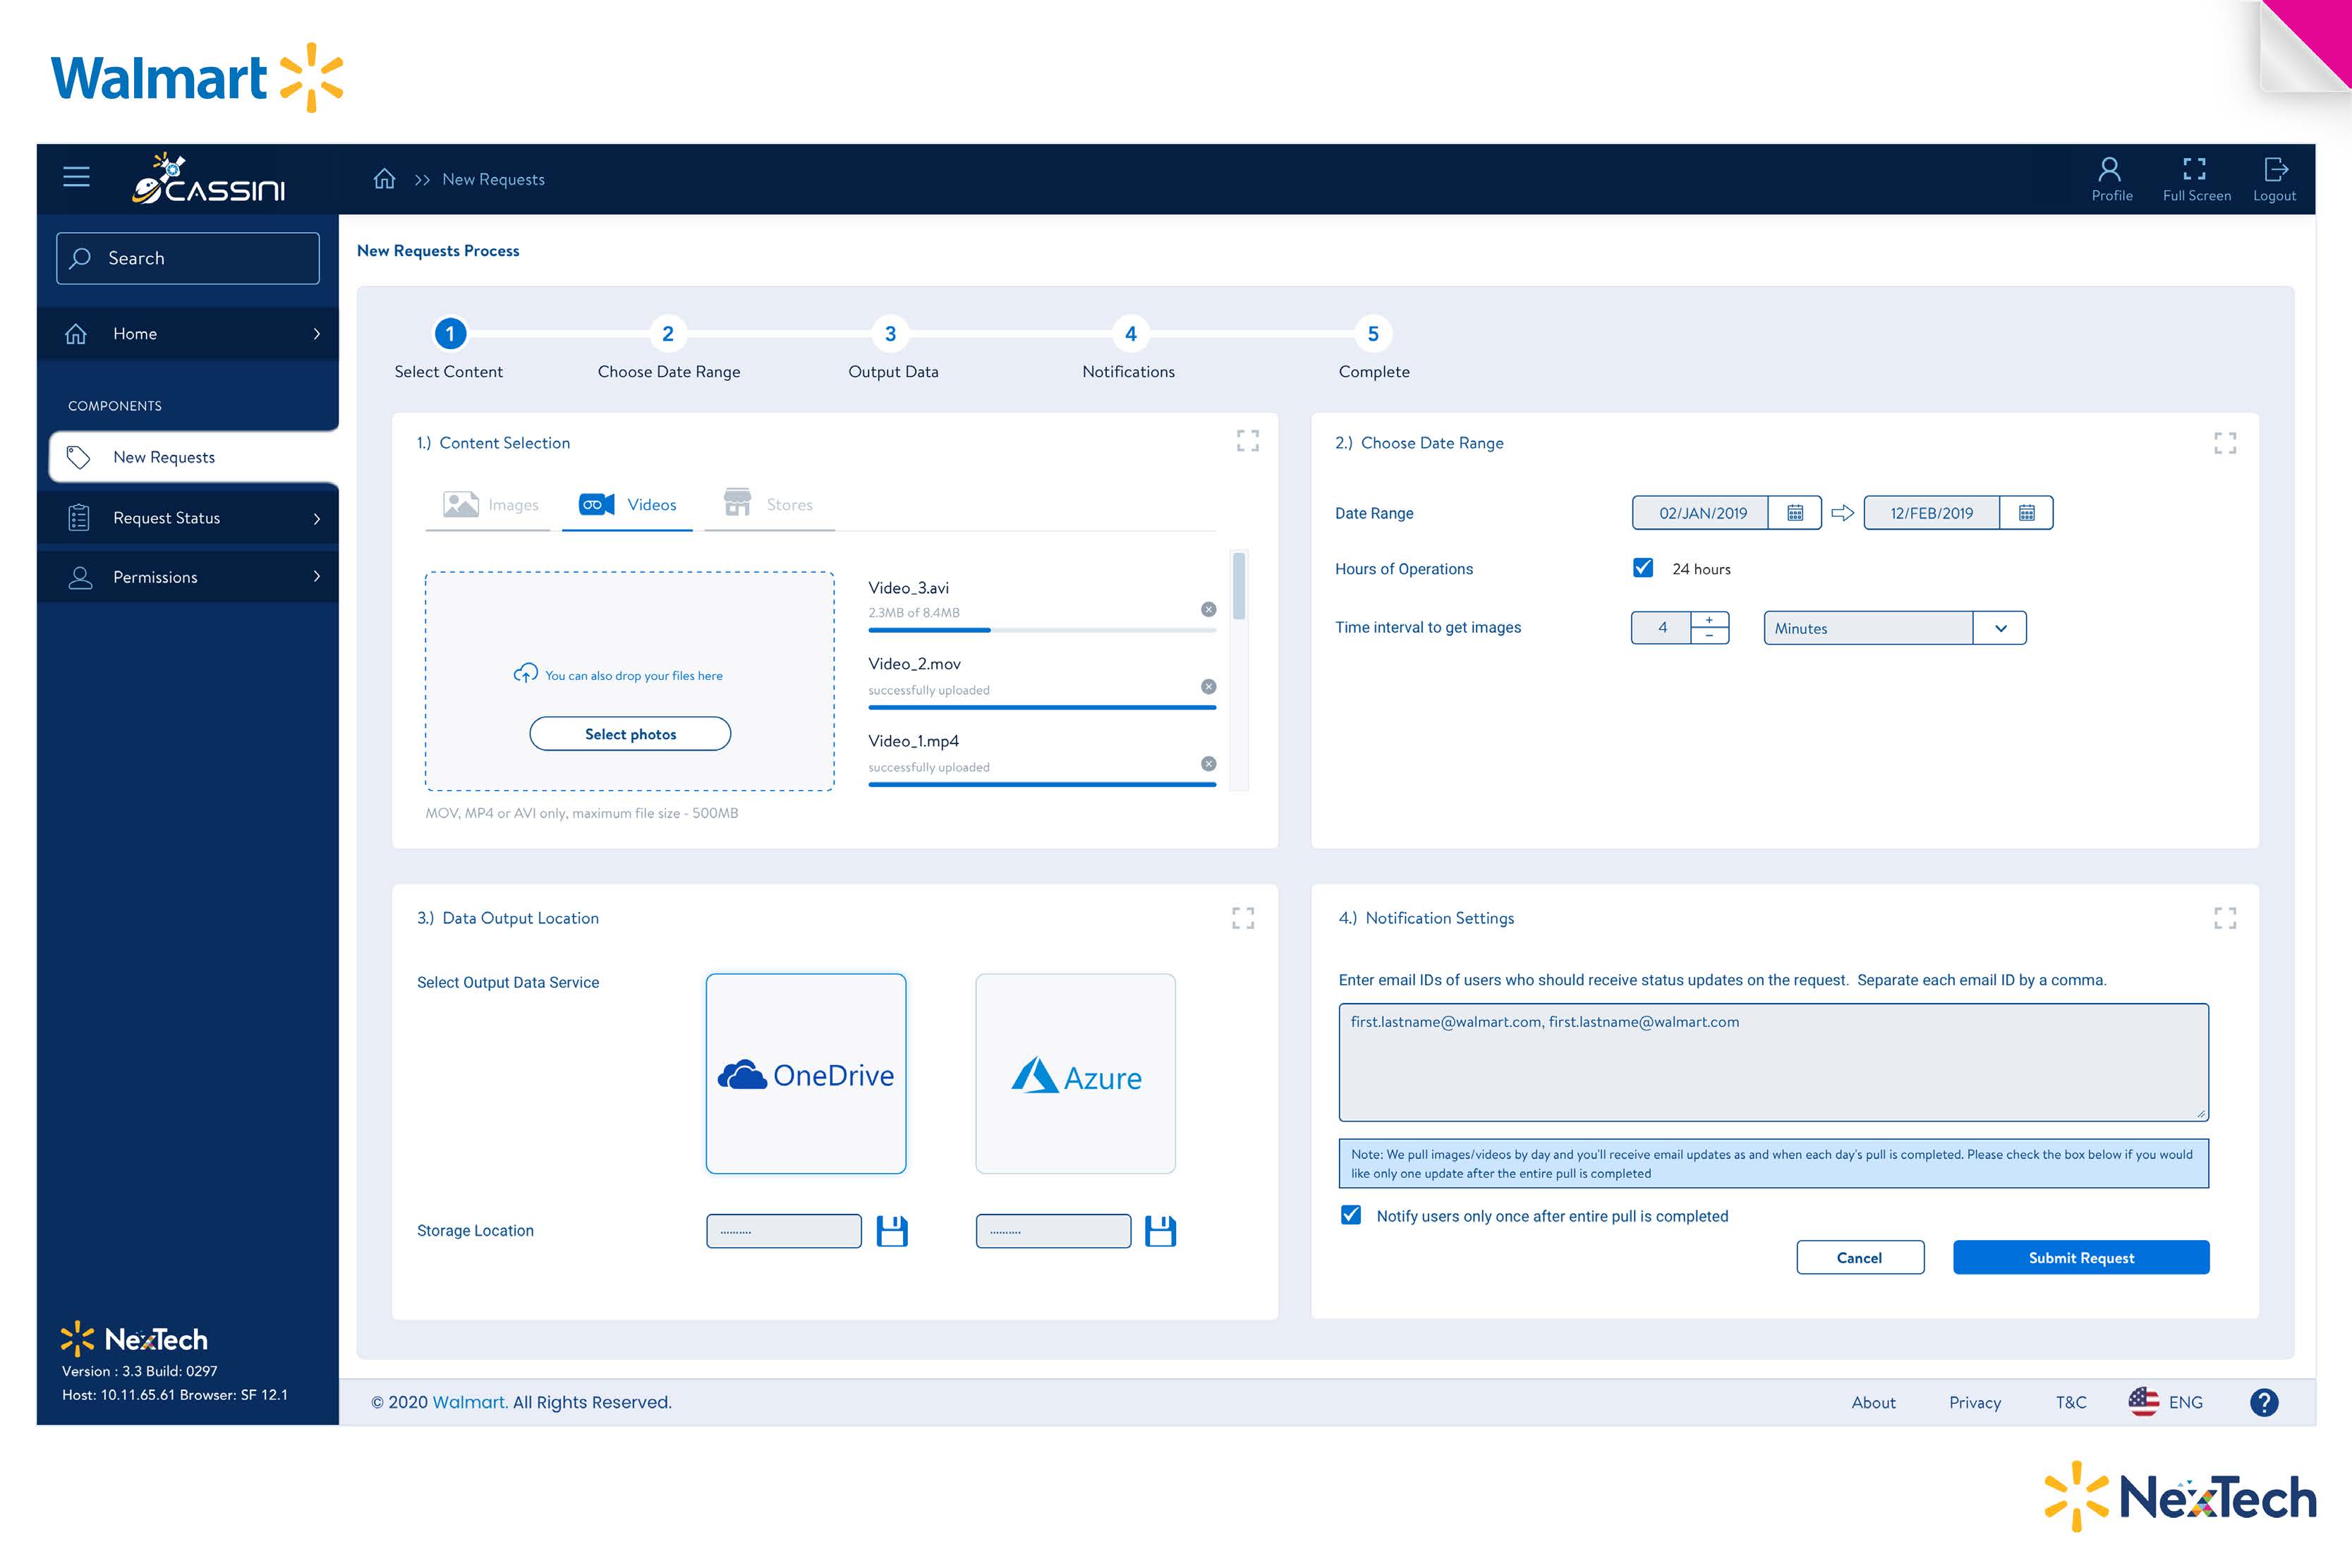
Cassini · Finding the media needed for review.
Cassini provides a repository and retrieval experience for camera video and extracted images, supporting internal review and authorized investigation requests.
Other Walmart projects
Separate projects. Different operational needs.
Also contributed to separate projects in receiving, order picking and health and pharmacy.
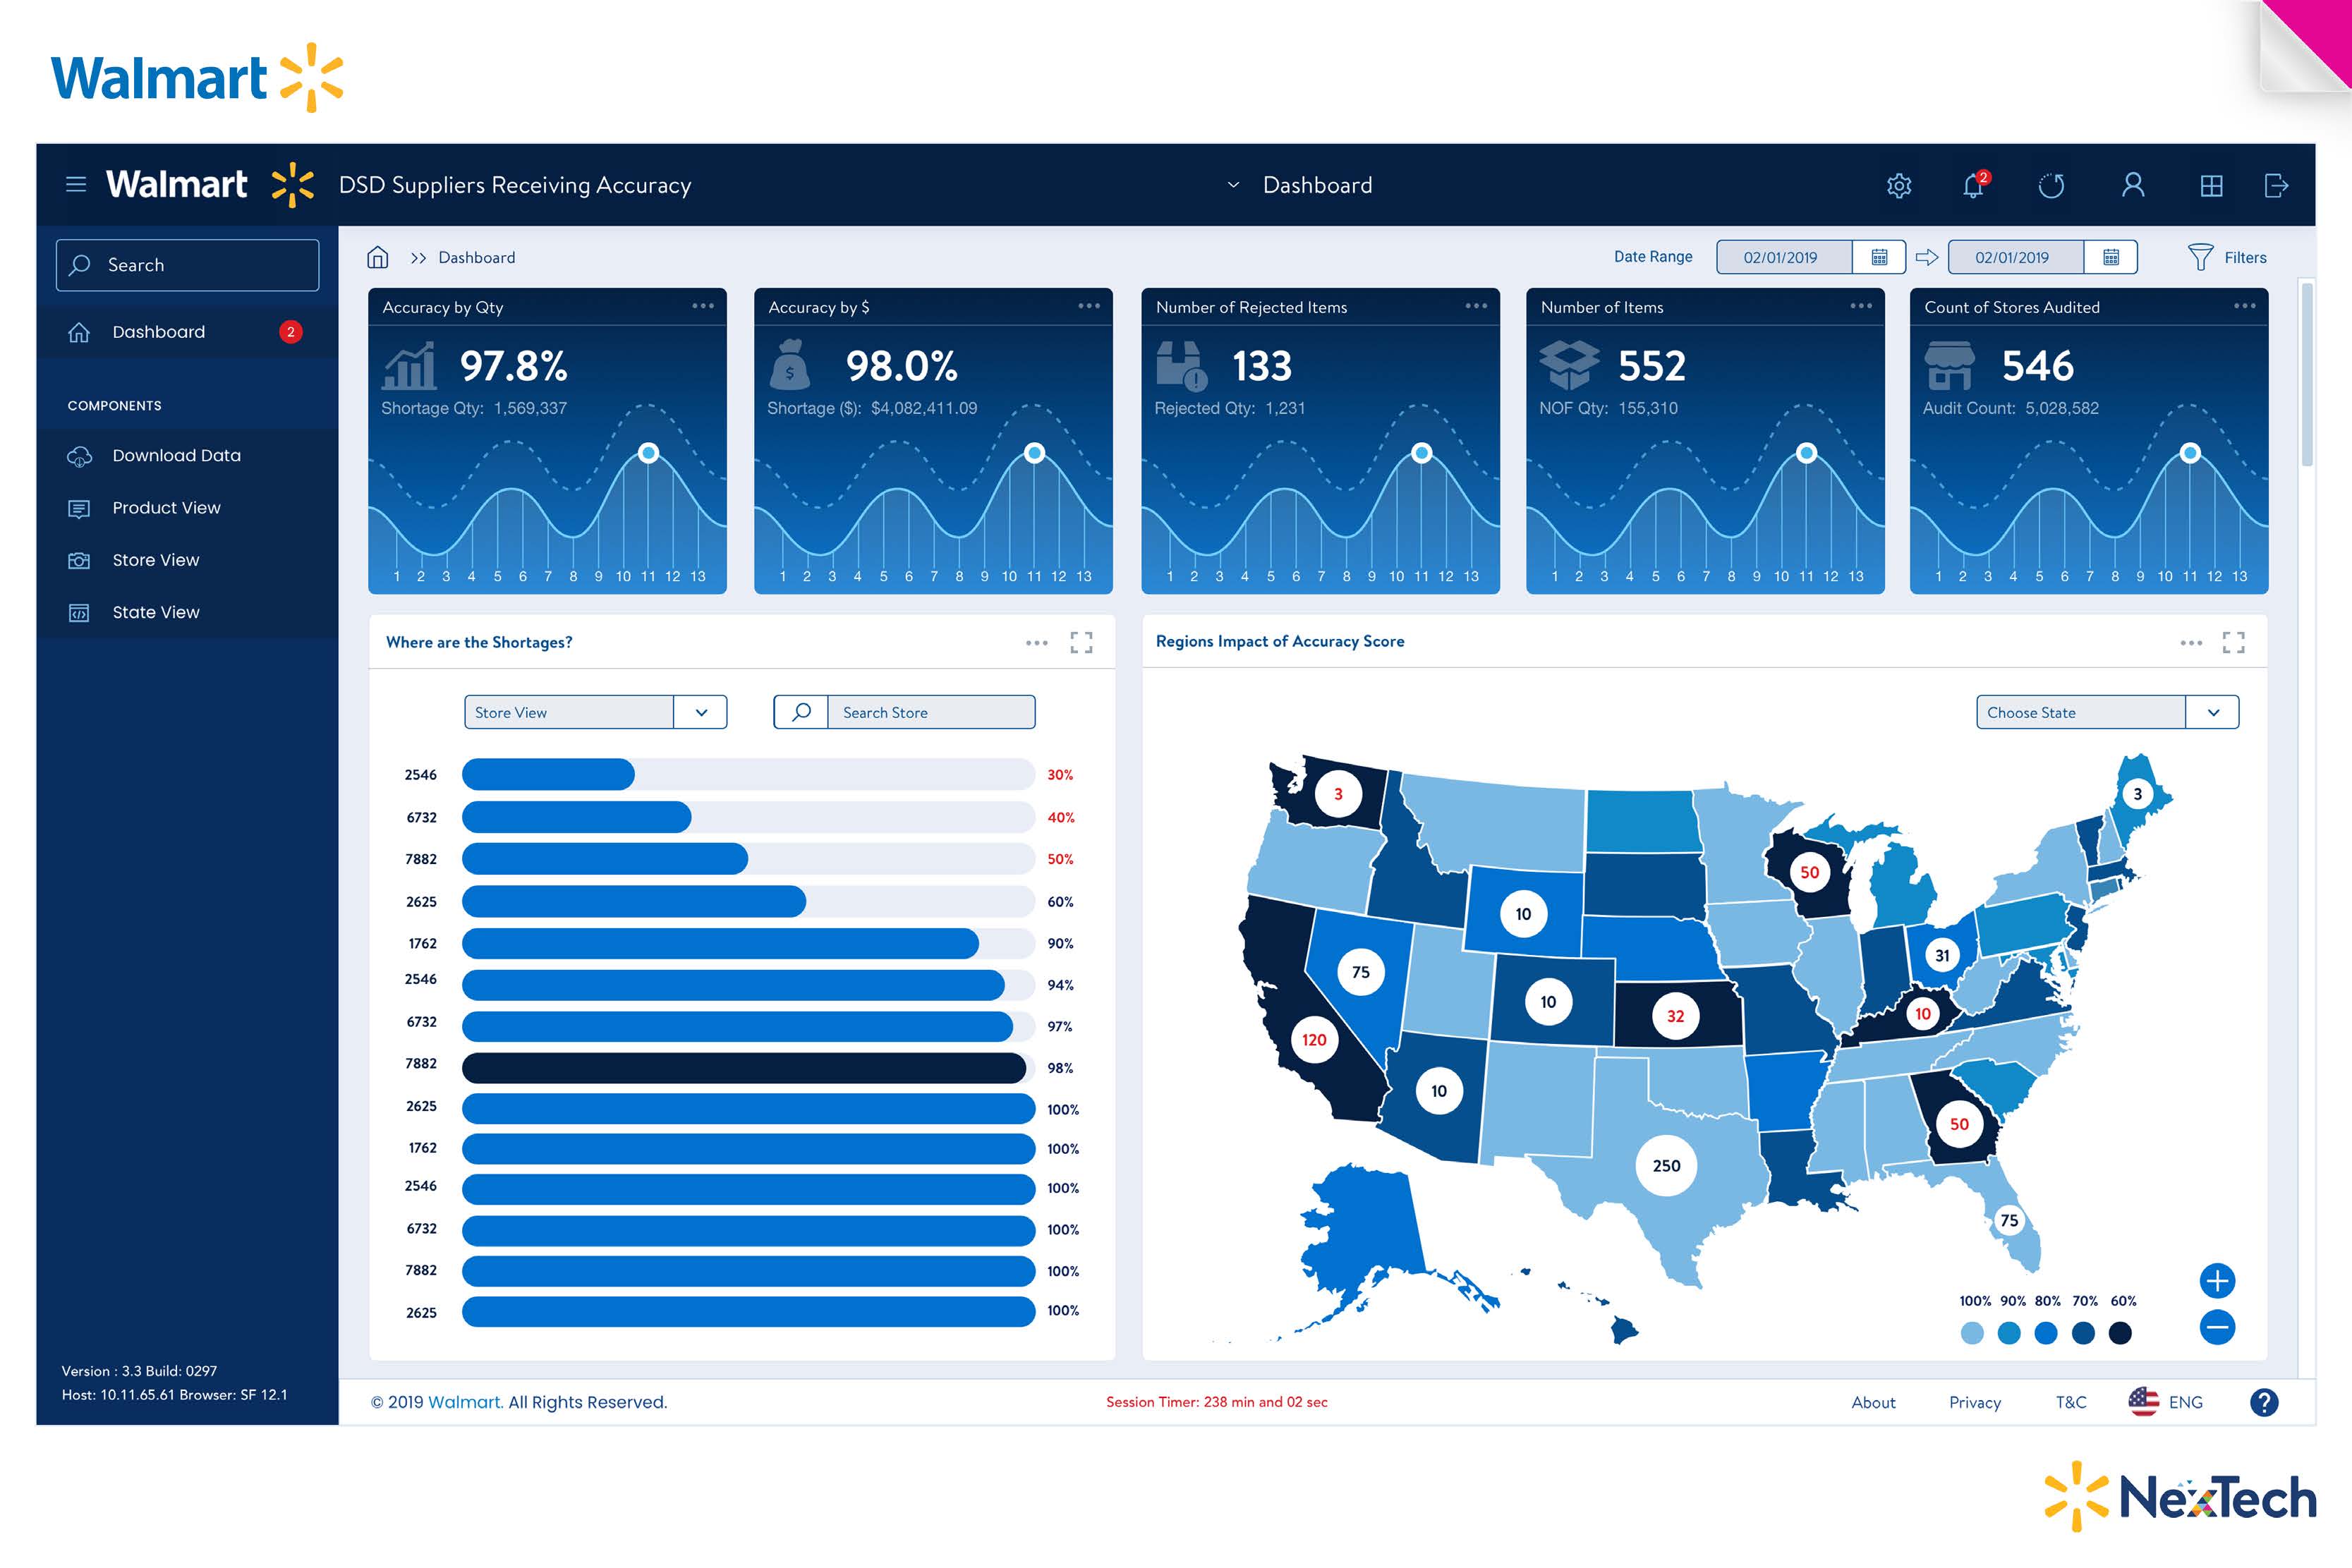
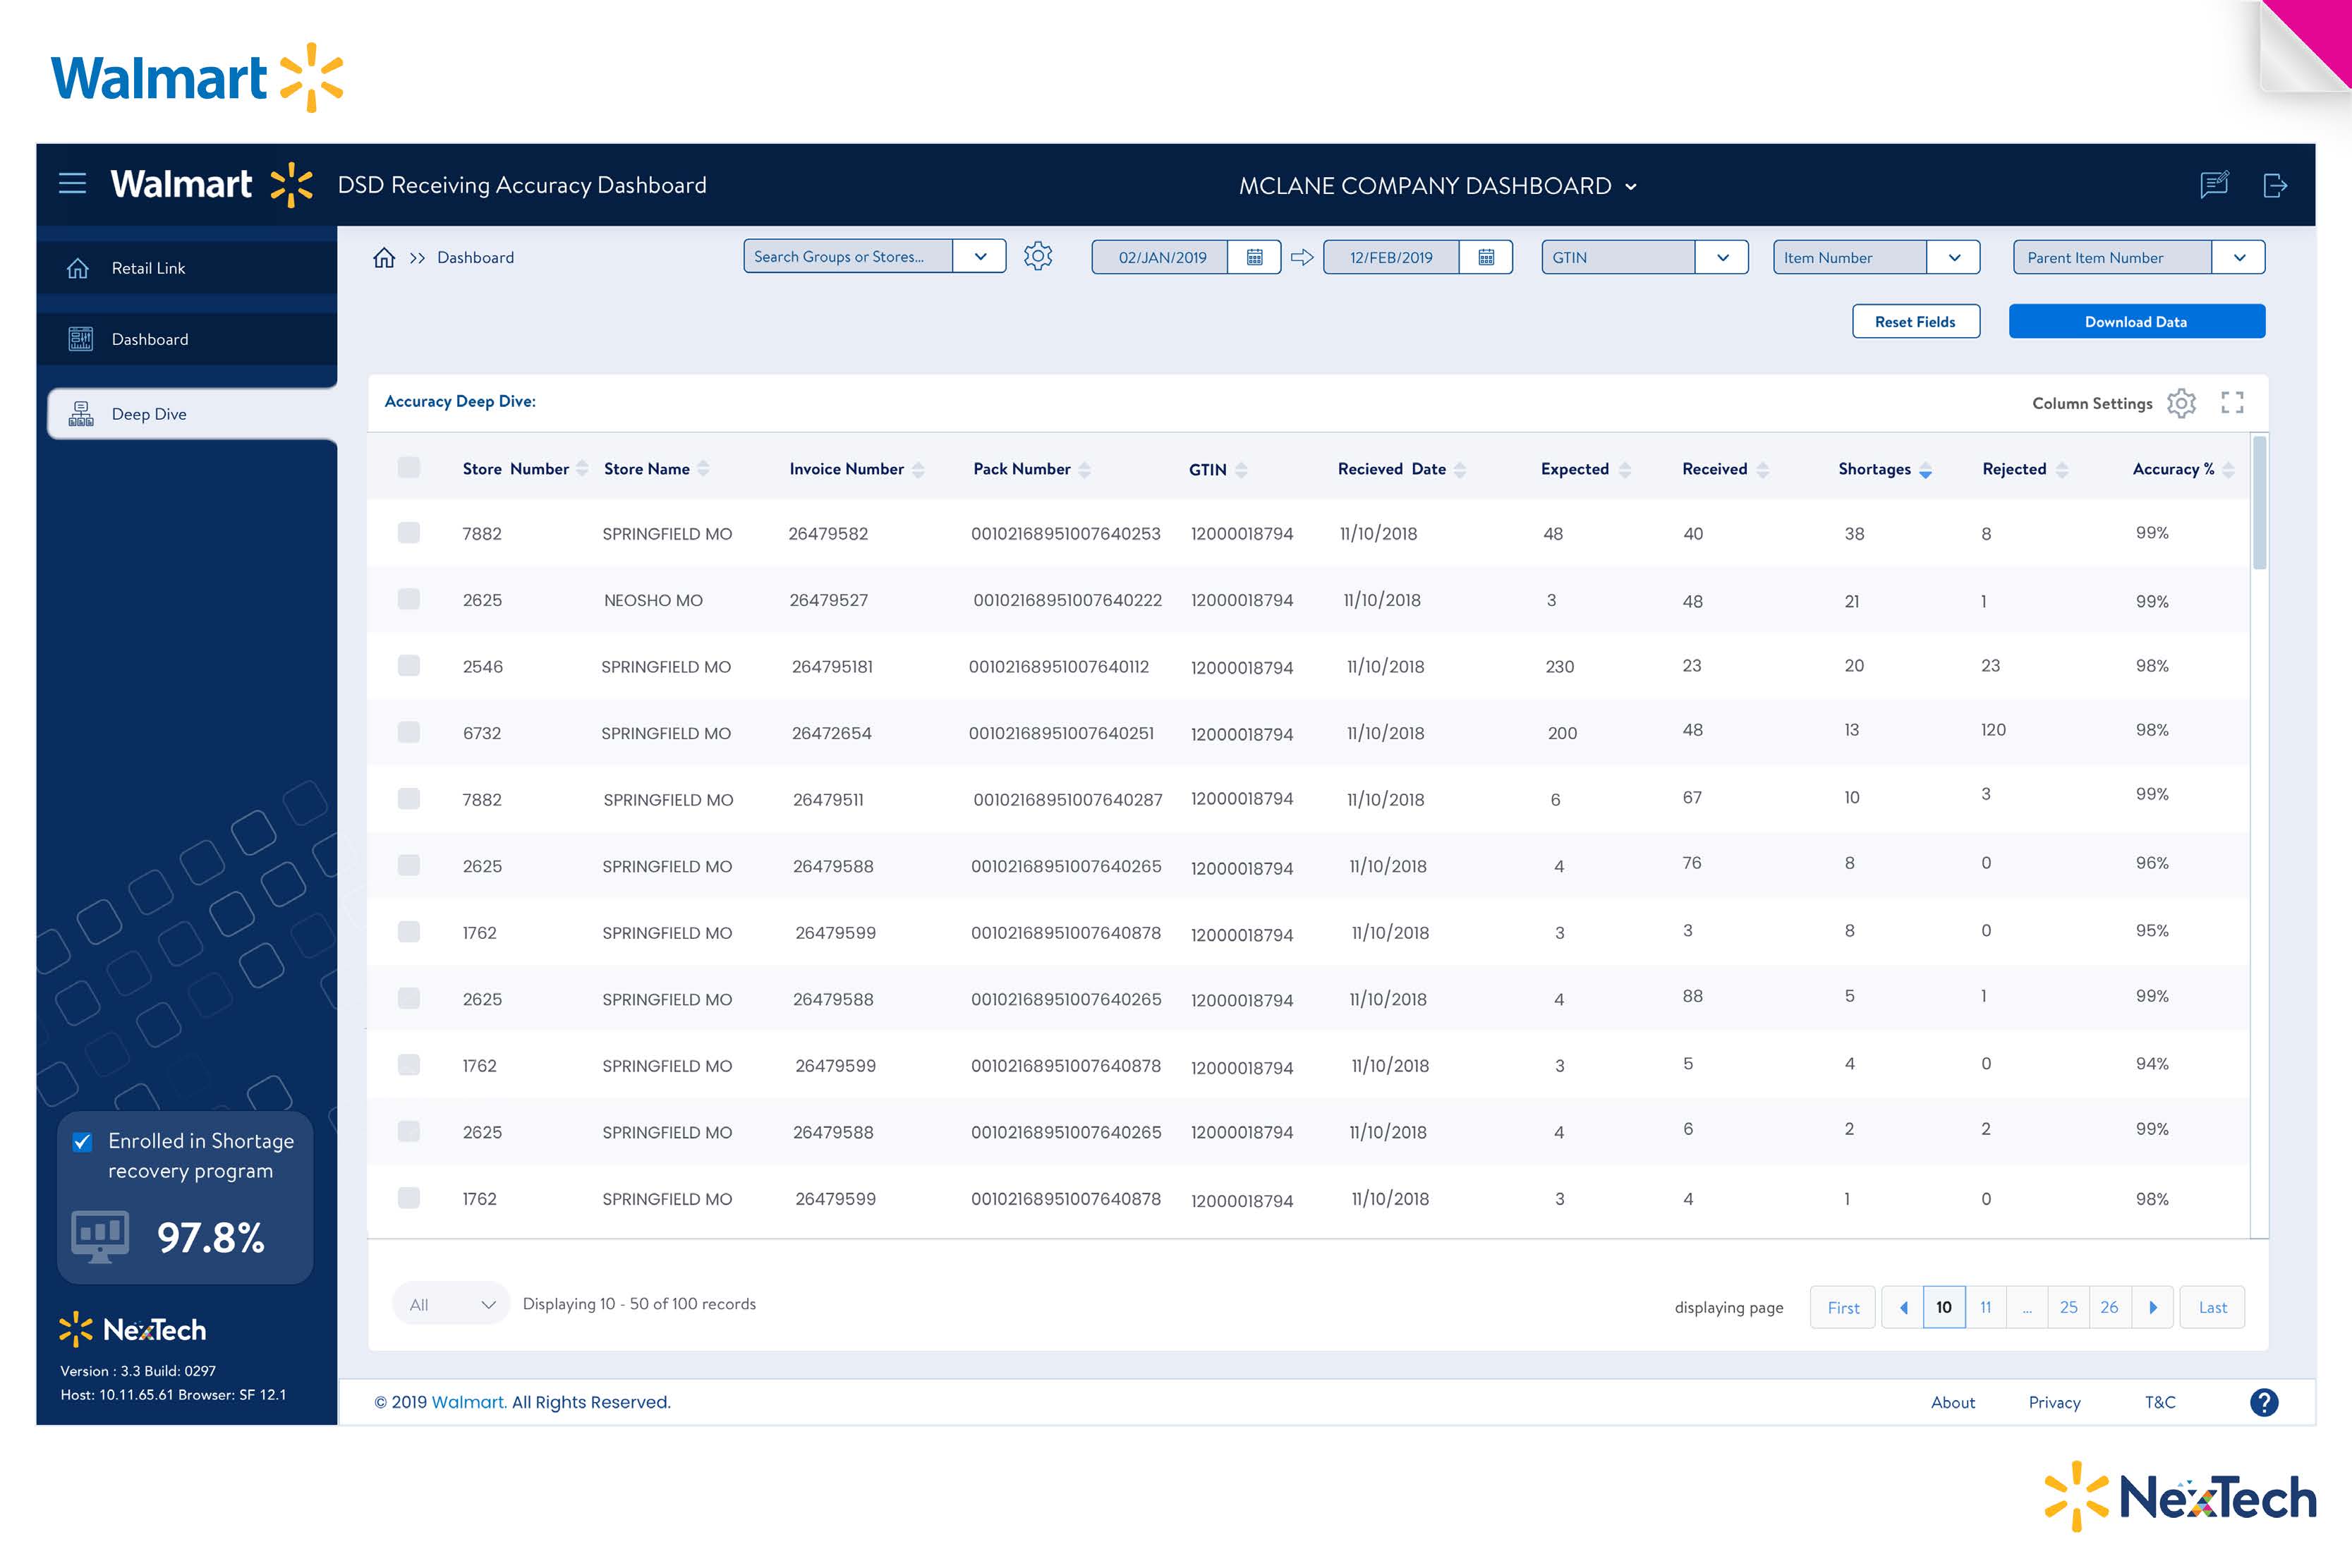
DSD · From receiving accuracy to store detail.
A national summary is useful only if a team can investigate the locations behind it. The receiving-accuracy screens combine quantity, value and rejection measures with store comparisons and a regional map.
Repeated filtering, hierarchy and table patterns connect the overview to the operational detail.
Libra · An efficient route through the store.
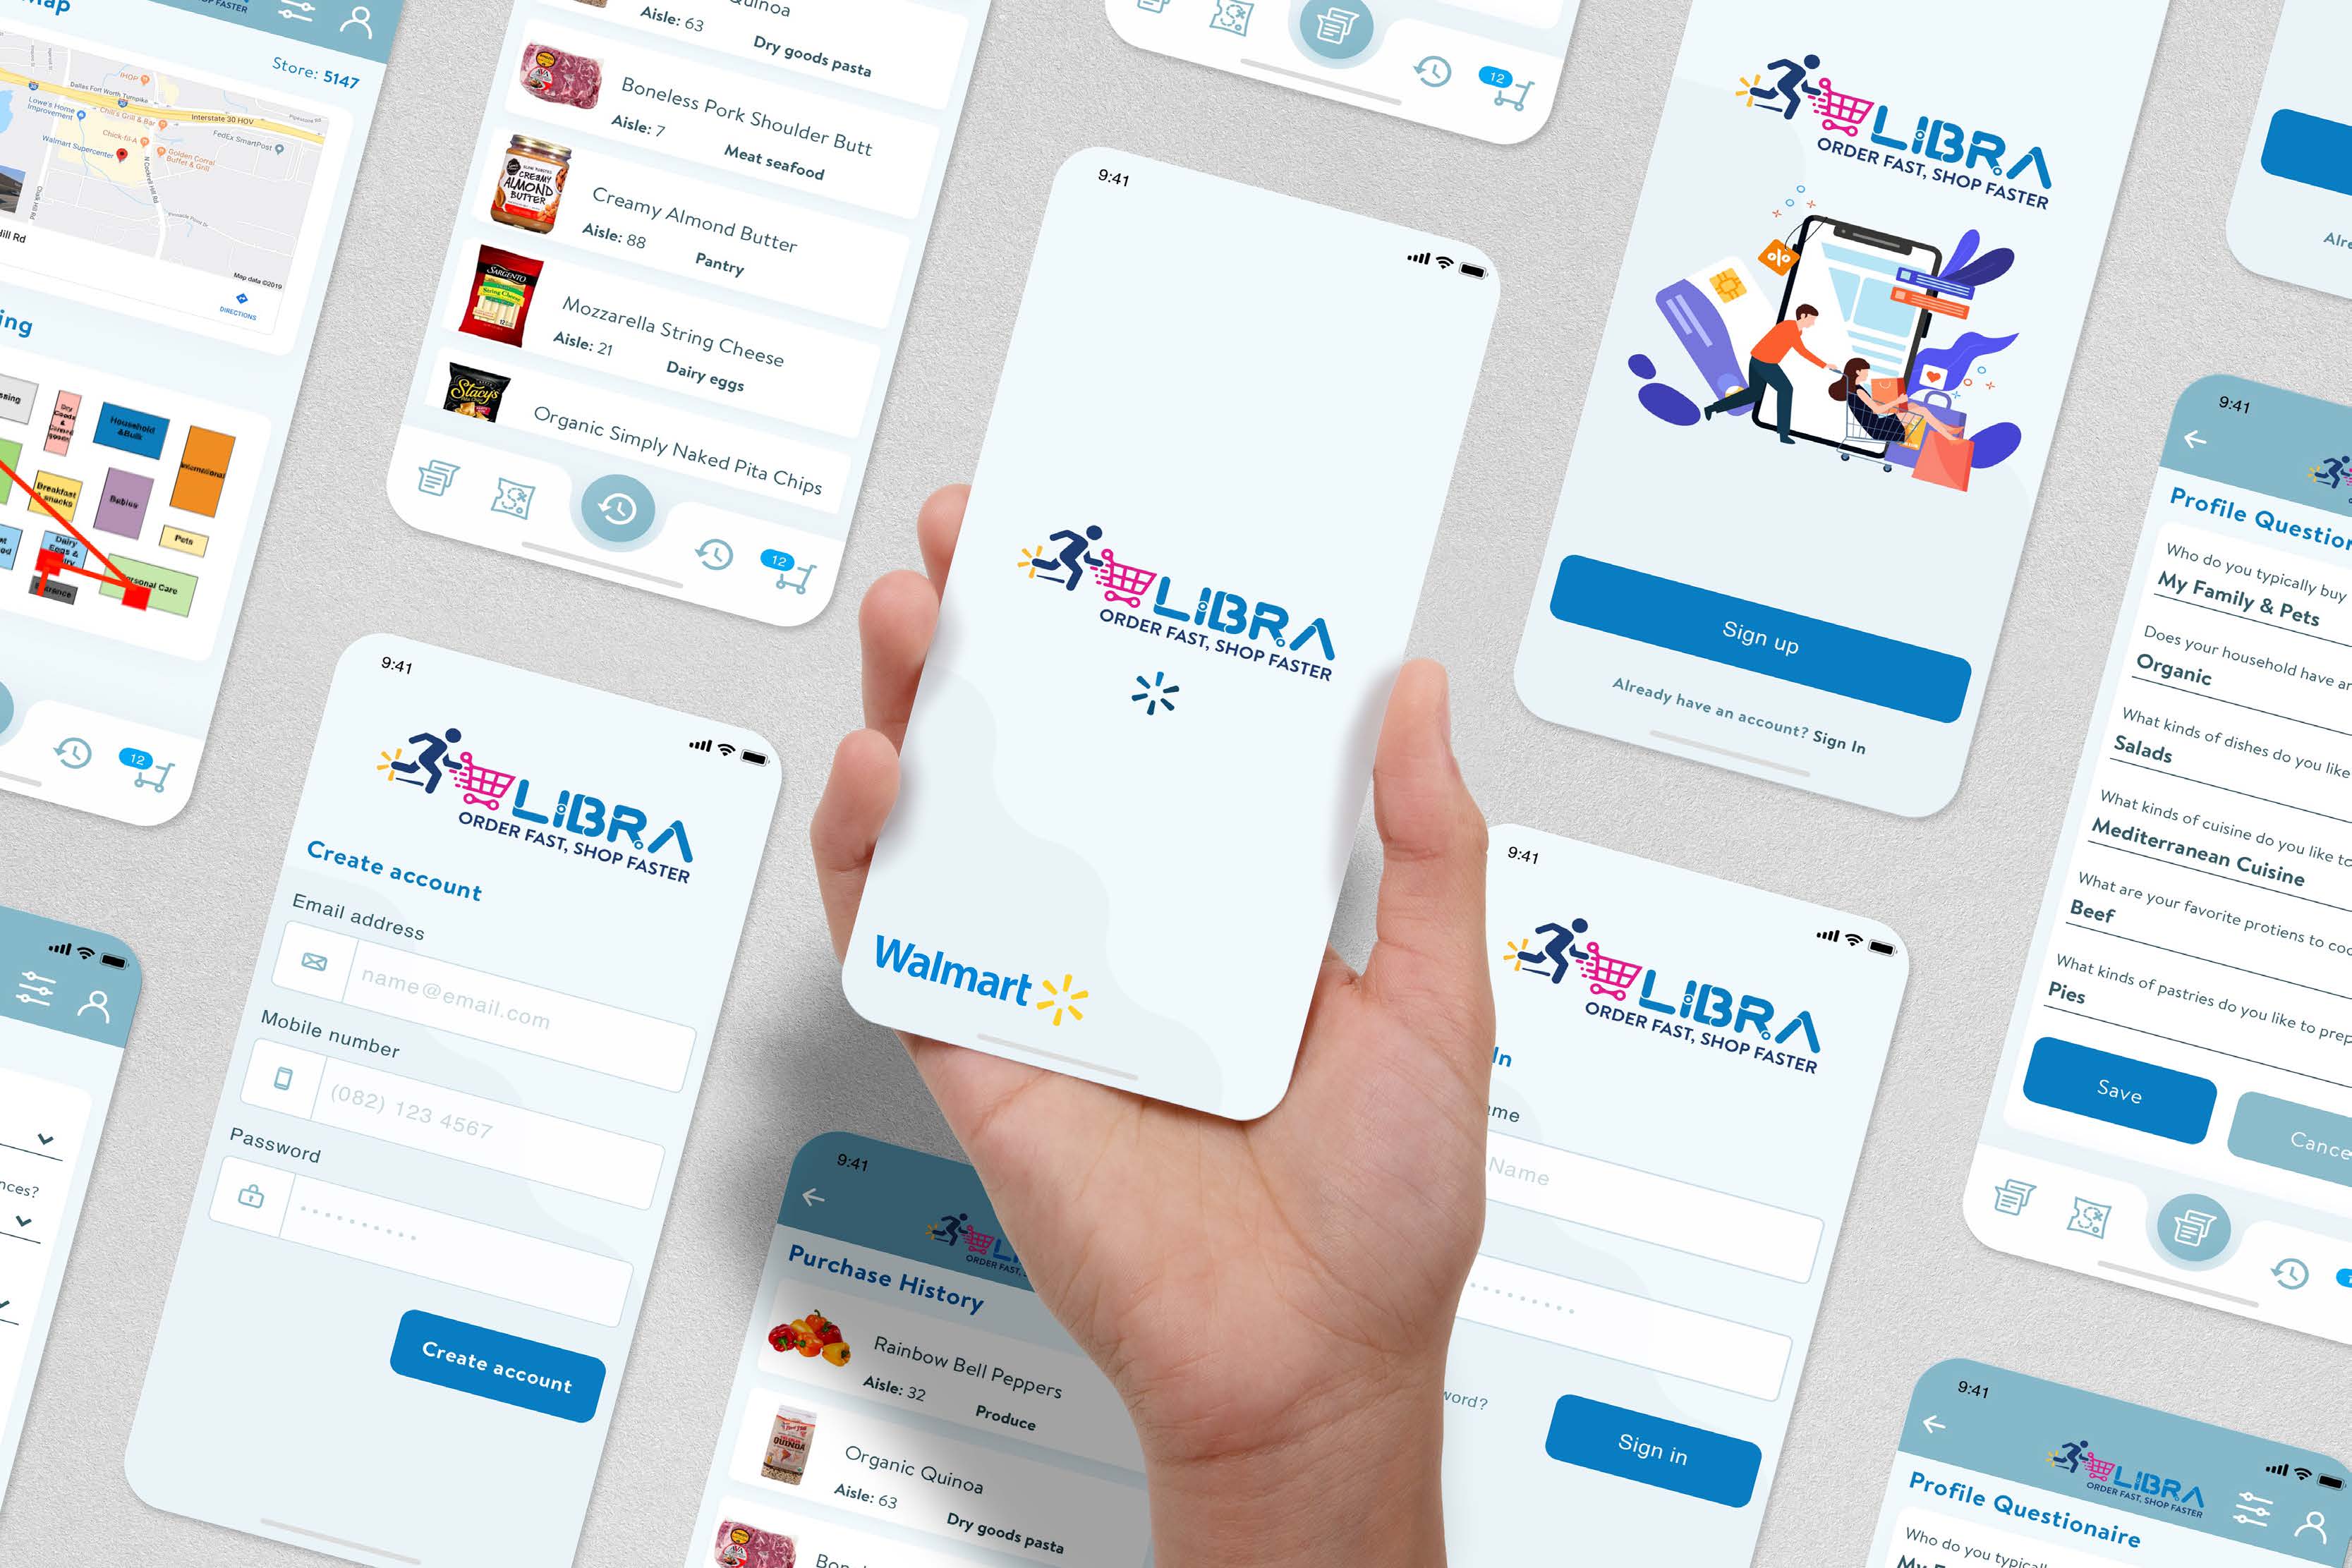
Libra connects customer orders to store floor maps and an efficient picking route from the associate’s chosen entrance through item collection and checkout. It began as a hackathon project and became an internal Walmart project.
Walmart Pharmacy
Collaborated with Walmart’s data science team on a pharmacy project, separate from the shared data-science platform.
06 / Outcomes & attribution
What changed, and how to read it.
The broader platform effort increased adoption by 15%.
The adoption change reflects a platform outcome, alongside the contributions of design, engineering, data science and product partners.
Business value.
The shared foundation supports training-data preparation, simulation, camera-media review and service-capacity analysis. Separate Walmart projects addressed receiving, order picking and health and pharmacy.
07 / Reflection
Lessons for future projects.
The leadership lesson is to connect platform standards to the decisions users actually need to make. Coherence is valuable when it reduces interpretation effort across tools.
A stronger next evaluation would measure successful task completion and comprehension alongside adoption. An increase in use does not establish whether people made better decisions.
Measurement notes
Platform adoption is a usage outcome. Assess it alongside task success and user understanding rather than attributing the entire change to a single interface decision.
Let’s talk about your next chapter.
Exploring Senior Director, Head of Design and VP opportunities.